Drafted 07/02/2026
Published 07/08/2026
Download our June 2026 Market & Economic Framework as a PDF HERE
OVERVIEW
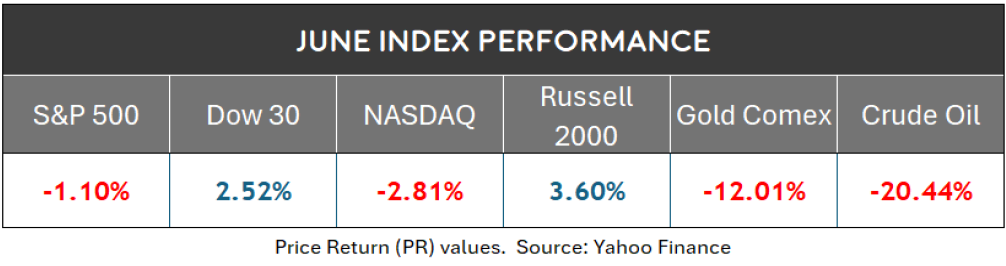
After stocks, in general, rallied for two consecutive months, the markets cooled in June. While the DJIA appreciated modestly, it diverged from more “risk heavy” indices such as the S&P 500 and Nasdaq which saw modest declines. Commodities, particularly gold and oil, saw sharp declines in June.
We wrote previously that June was likely to be a neutral or “choppy” month following a strong earnings season, and until the next set of earnings announcements begins in mid-July. Additionally, that, in June “we are likely in a window of increased volatility and markets which will be more sensitive to price pressures (oil, inflation) and headline news (Iran) than they were in May”.
While inflation remains a persistent (and increasing) headwind, the broader set of economic and market indicators which we track continues to reflect a generally stable and supportive environment.
LIFETIME MOMENTUM & VOLATILITY INDEX (LMVI)
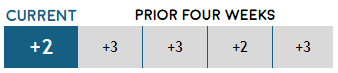
Lifetime Retirement Partners maintains an index designed to measure short-term stock market momentum and volatility. The Lifetime Momentum & Volatility Index (LMVI) provides guidance on when to adopt a more conservative or aggressive posture within portfolios. The idea is not to “time the market”, but to identify periods of elevated risk or improving conditions.
The LMVI turned negative (risk-off) in February. However, since April 3rd it has returned a consistently positive value. The current reading of +2 (on a scale of -4 to +4) reflects that volatility has declined and momentum has remained with the stock market. This encourages a fuller expression of risk within portfolios.
Download the most recent LMVI Report HERE
LIFETIME EARLY WARNING SYSTEM (LEWS)
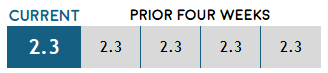
Lifetime Retirement Partners maintains an index which measures economic fragility. The Early Warning System is not intended to be a recession predictor, per se, but is calibrated to score eight market and economic indicators which tend to be leading indicators of weakness.
While the score ticked up slightly at the onset of the Iran conflict (and subsequent market sell-off), it finished June where it has sat for most of 2026: a “benign” score of 2.3 (out of 10). This indicates very little fragility in the economy. This isn’t predictive that investments appreciate, but it does indicate a clear economic runway with a lack of fundamental stress.
Download the most recent LEWS Report HERE
MACROECONOMIC INDICATORS
Our proprietary economic database evaluates Macroeconomic Indicators across two separate categories: Real Consumer Demand and Economic Growth and Activity. The score remains positive, where it has resided for over a year, reflecting a stable economic backdrop.
REAL CONSUMER DEMAND: Inflation remains a key pressure point for both the economy and the consumer. The latest Personal Consumption Expenditures (PCE) inflation reading is higher than a year ago and pricing pressures have reasserted themselves.
ECONOMIC GROWTH & ACTIVITY: GDP data has been weak in the prior two quarters, partly influenced by tariffs and a government shutdown, and tools such as the Federal Reserve Bank of Atlanta’s GDPNow calculator forecasts only moderate growth. However, broader measures such as Gross Output, along with continued expansion across services and manufacturing sectors, suggest that underlying economic activity remains intact. Additional production indicators, including truck tonnage shipped, have improved year-over-year, reinforcing the view of continued expansion.
View our most recent Macroeconomic slide deck HERE
MONETARY INDICATORS
Our proprietary economic database evaluates Monetary Indicators across two separate categories: Federal Policy & Lending & Liquidity. The score remains positive, where it has resided for over a year, reflecting a broadly supportive monetary backdrop.
FEDERAL POLICY: While odds of further Federal Reserve rate cuts have declined dramatically from the beginning of the year, rates are still 25% lower than the 2024 peak. Money supply (M2) has expanded at a moderate pace over the past year, well below the surge seen during the pandemic and consistent with a stable growth environment.
LENDING & LIQUIDITY: Bank lending has steadily increased over the past year, supporting economic activity. While business loan delinquencies have moved slightly higher, they remain contained and do not currently signal meaningful stress in credit conditions.
View our most recent Monetary Indicators slide deck HERE
CONSUMER STRENGTH INDICATORS
Our proprietary economic database evaluates consumer strength across two primary areas: Employment and Consumer Health. The current overall score is +2 (neutral), reflecting a stabilization from earlier weakness (the score was negative to start the year).
EMPLOYMENT: The improvement in our overall grade relates to stabilizing employment conditions, which have improved modestly. Initial jobless claims remain low, and after a gradual rise through 2025, most key unemployment measures have shown improvement. The labor market continues to reflect a “low hire, low fire” environment which has strengthened in the first part of the year.
CONSUMER HEALTH: While concerns around a stretched consumer persist, the data remains more balanced than media narratives suggest. Household debt has increased year-over-year but at a moderate historical pace. Consumer delinquency rates have edged higher from recent lows but remain near longer-term averages. At the same time, real wages have outpaced inflation for twelve consecutive quarters, providing continued support for consumption.
View our most recent Consumer Strength slide deck HERE
MARKET FUNDAMENTALS
While our framework does not assign a formal score to stock market fundamentals, the current assessment remains positive, reflecting a broadly supportive backdrop for equities.
Because of the massive recent run in equities, we have downgraded our outlook from “Positive” to “Moderately Positive” in the near future. The forward price-to-earnings ratio of the S&P 500, which ended June at 21.47, is modestly lower than where May finished (22.37). It is roughly at parity with where the year started (22.27). While there may be market difficulty in the first few weeks of July, our expectation is that we are moving into another strong “earnings season” which begins on July 14th. Stocks are likely to re-anchor to (hopefully positive) earnings announcements. Any level of selloff that occurs in the first part of July should not be alarming.
View our most recent Market Fundamentals slide deck HERE
CONCLUSION
Following a rapid recovery from April's lows, a period of consolidation should not be surprising. Markets have largely returned to being driven by fundamentals rather than fear, and those fundamentals remain generally favorable. While inflation, valuations, and geopolitical developments warrant continued attention, the combination of improving momentum and a resilient economy continues to provide a supportive backdrop for long-term investors.