our office locations


Our updated economic outlook, based on current market conditions, recent historical data, and forward-looking projections. We study dozens of leading economic indicators to analyze the condition of the stock market.

NOTE: A PDF version of this report can be downloaded HERE.
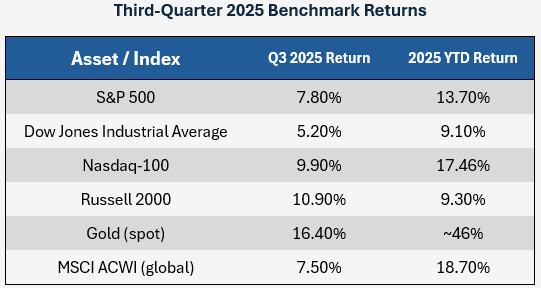
Momentum continues in the stock market, with strong gains in each major sector (including gold and global investments). During the last quarter, this “everything rally” became broader as the small-cap Russell 2000, which had been negative earlier in the year, joined the momentum with a quarterly gain of nearly 11%.
The Down Jones Industrial Average “lagged” the other performers but was still up 5.2% for the quarter and over 9% for the year. The MSCI All World Global Index underperformed the remaining U.S. benchmarks for the quarter but still leads the major American indices year-to-date.
After a massive sell-off earlier in the year, U.S. benchmarks continue to rebound and rally to new highs. We think that the continued asset appreciation is, in the main, justified.
Gold continues to outperform them all, up nearly 50% for the year. There are several theoretical reasons for this overperformance, none of which we will go into deeply here except to point out that even items which normally work as a counter-cyclical hedge against stocks continue to rally in parallel.
The economy remains in a period of economic expansion. A worthwhile question isn’t whether this is the case, but how far we are through an economic growth cycle. With many of the data points which we track indicating a positive environment, we have come to believe that we are in neither the early nor later stages of an expansionary cycle. As indicated by robust stock returns, we seem to be right in the middle of the “good times”.
There is always some weakness in the data. Economic indicators are almost never all positive or all negative, and the larger the pool of data the more likely some divergence is. Economists and Investment Managers are primarily looking for degrees of concern; which way does the data lean?
As new information has become available, we have walked back some previous caution toward a slowing economy. During our last quarterly report, the GDP was negative and corporate profits were slowing. We only took those concerns as far as moving most of our portfolios from a risk-heavy stance to a risk-neutral stance. During the course of the third quarter, we returned to a stance of taking slightly more risk than the market (to be defined in more detail in a later section).
Current economic characteristics which suggest a healthy, “mid-stage” bull market:
Tariffs continue to overhang the stock market and economy, in part, because they add confusion to the economic outlook. We often tell clients that the stock market can price in any known factor and move on—what it struggles with is the unknown.
Investors were highly sensitive to tariff announcements leading up to and following Liberation Day. This was the date where President Trump announced a massive set of worldwide tariffs before walking them back and beginning to modify them only days later. Since then, tariff announcements have been constant, and the market has begun to tune them out as static.
This is partly true due to the potential future of these tariffs:
We concur with the betting odds on Polymarket, which currently predicts about a 60% chance that the tariffs will be struck down (at least in part).
While this isn’t the correct venue to attempt to explain it at length, some brief discussion is required as it will impact the future economy.
The root of the tariffs in question come from an Executive Order which President Trump signed on 02/01/2025. In this, he declared a “national emergency” and referenced issues such as fentanyl trafficking and the national trade deficit. The recent “country-specific” tariffs were imposed under this act. It has also been used to impose a 10% “blanket tariff” on all imports.
During court proceedings and, more generally, to the public, the administration has struggled to explain its declared tariff powers:
It’s most likely that the Supreme Court will clarify tariff powers as being limited to other, existing Congressional Acts such as the Trade Expansion Act of 1962. These grant the executive specific powers—especially in cases of a blanket industry tariff, such as a levy on steel. However, nation-specific tariffs or broad blanket tariffs, will likely not be permitted through the IEEPA.
We have written a considerable amount about tariffs this year and expect the issue to wind down. This may be negative for the market in the short term as it will lead to significant asset repricing, but clarity is best for the market in the long term.
To track the strength of the consumer, we monitor a myriad of unemployment data along with real (after-inflation) wage growth. We also study consumer credit outstanding as sudden shifts upward can indicate weakness in the economy (a “stretched” consumer).

While unemployment figures have ticked higher in recent months, they remain below both recent and historical averages. In studying unemployment figures, our preferred gauge is the U6 Unemployed Rate, as it includes not just those fully unemployed but also citizens “Employed Part-Time for Economic Reasons”. Currently at 8.1%, this unemployment rate has been ticking higher over the last year from a recent low of 7.5%. To provide some context, this has had a simple average of about 9.5% during the last fifteen years. It peaked around 17% during the Great Recession and briefly spiked over 22% during Covid.
The fact that unemployment has been slowly inching higher, not just this year but since 2023, is why the Fed has moved to start cutting interest rates while scaling back its Quantitative Tightening programs.
Real Wage Growth (wage growth above inflation) has been positive for over three years. The Bureau of Labor Statistics value from August found that wages outpaced inflation by an annualized 1.1%, which is approximately the average of where this number has been since the aftermath of Covid. While it may not depict booming growth, continued wage expansion above inflation indicates a stable, expanding economy. So does an analysis of Total Consumer Credit Outstanding. The test of consumer indebtedness has climbed by only 0.3% over the last year, indicating that consumers, at a minimum, are not stretched more then than they were one year ago. Combine the two data points: wage growth has outpaced consumer debt levels over the last year.
We track a number of macroeconomic indicators which can generally be broken down into two categories: Economic Growth and Inflation. The factors continue to depict an economy which is strong but shows some signs of slowing around the edges, coupled with sticky inflation which began to reassert itself in late-2024.

Gross Domestic Product (GDP) is a key measure of economic activity. It estimates total monetary value of all final goods produced in a nation. While GDP contracted in the first quarter of2025 (-0.6%), it rebounded substantially in the last quarter. A growth rate of 3.8% in Quarter 2 of 2025 was the highest expansion rate in several years. However, this may be an overstated sign of strength. The quarter saw a massive drop in imports, which are subtracted from GDP (so that it can be a measure only of domestic production). This has the effect of distorting the number.
One of our preferred forward-looking indicators is the GDPNow Forecast. Revised regularly by the Federal Reserve Bank of Atlanta, it projects the next quarter of GDP. The indicator has a history of relatively accurate forecasts, including correctly predicting an economic contraction inQ1 of 2025. As the third quarter draws to a close, their current projection for growth in that quarter has surged to 3.9%. This compares to last year’s year-over-year increase of 3.1% (Q3 2024) and indicates steady-to-expansive growth in the economy.
The current projection for the entire year is 1.7% GDP growth (source: Philadelphia Fed’s Survey of Professional Forecaster). This growth is lower than the average of the last five years (which is about 2%) but it is primarily weighted down by the one negative quarter.

Instead of measuring only the finished goods as GDP does, Gross Output (GO) measures the total sales or receipts of all industries in the economy. This includes both final goods and services and intermediate inputs used in production. While Gross Output often tells the same story as GDP (they have a correlation of over 90%), we track it in addition to GDP because it is said to provide a more sensitive and earlier signal to expansions and contractions. Where GDP shows modest expansion over the prior year, Gross Output shows a slight contraction (5.0%down to 4.8% growth). While this is a fractional decline, the divergence of the numbers should be monitored.
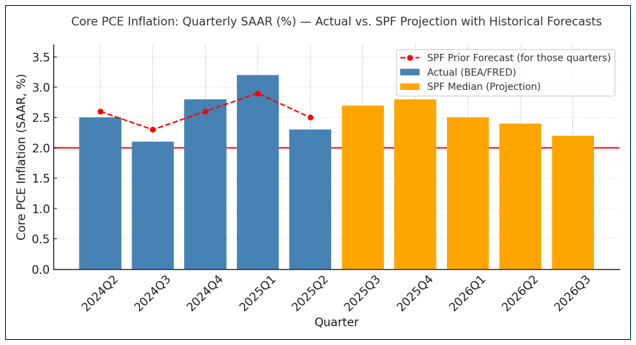
The Personal Consumption Expenditures (PCE) Price Index measures the average change over time in the prices paid by U.S. consumers for goods and services. The Fed prefers PCE over CPI because it has broader coverage than CPI and adjusts for changing consumer behavior (substitution).
At the same time that the Federal Reserve was initiating a campaign of rate cuts last year, inflation began to reassert itself in the later part of 2024. PCE inflation hit a low of 2.1% in September of 2024—nearly drifting back to the Fed’s 2%target—before beginning to rebound.
The current read of 2.7% is 35% above the Federal Reserve inflation target of 2%. While the Fed is potentially set to cut rates several times in 2025 (to be detailed shortly), those cuts will be hyper-sensitive to inflation reads over the remainder of the year.
The Philadelphia Fed compiles forward looking forecasts of PCE inflation as projected by the Survey of Professional Forecasters (SPF). While some months were under- or over-predicted, during the last five quarters the surveys had an accuracy of about 92% (note that actual PCE numbers were converted into quarterly averages in the graph below). The SPF survey projects inflation to continue to reassert itself for the remainder of this year (while not breaking above 3%) before beginning to recede toward the Fed’s 2% target next year. These projections reveal where the Fed is now seeing a pathway to begin rate cuts, though those cuts will remain hypersensitive to projections merging with reality.
Purchasing Managers’ Index (PMI) conducts surveys with purchasing managers regarding orders, production, and employment. They are a leading indicator of economic health. We track both the Manufacturing and Service sectors. In this data, 50 is the watermark value. Under 50 indicates a contraction, while values over 50 indicate expansion.
The Services indicator includes categories such as Finance, Healthcare, and Retail. The current level of 52.0 indicates modest growth and recent readings have been mostly positive (only two negative months in the last two years). The most recent number shows a rebound from July’s release of 50.1.
At 48.7, Manufacturing numbers remain in contraction territory. While this is an improvement from 48.0 in July, the last report indicating growth was in February of this year.
Trading Economics creates a forward-looking model for both Services and Manufacturing. Manufacturing is expected to climb out of its contraction and toward an even 50.00 score by early 2026. Services are expected to fluctuate some but remain above the 50.00 level in the coming 12 months.
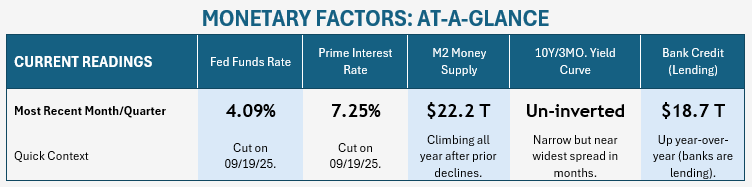
Moving into the fourth quarter of 2025, monetary indicators point toward a generally positive picture for the American economy and, especially, stock valuations. Interest rates are dropping (which is stimulating for stocks), and, while narrow, the yield curve is currently un-inverted. Bank lending remains unrestricted and money supply growth has normalized.
One of the primary components in how stocks are valued is the overall interest rate environment. Historically, one of the most stimulating things for stocks is a cut to the Effective Federal Funds Rate. The logic is straightforward: as rates drop on instruments like CDs, there is less competition for stocks. Also, lower rates directly impact the bottom line of stocks: the lower the cost of debt servicing, the greater the profit. Conversely, as rates climb, higher non-stock yields act as competition.
The Federal Reserve hiked rates multiple times in 2022 and 2023 in an effort to combat inflation, ultimately bringing rates to the highest level since before the Great Recession. As inflation slowed, the Fed cut rates by one full point in 2024. Rates moved from a target of 5.33% down to 4.33%. After a long pause, rate cuts resumed in September of 2025, with a quarter-point cut bringing the rate to 4.09%.
Having received one cut, the FedWatch predictor tool currently projects two more rate cuts in October and December totaling another 50 basis points (at a likelihood of over 90%). A ~40% chance of a January rate cut is projected as well.
There is some risk to these cuts which can be seen when reflecting on the Federal Reserve’s dual mandate. With the Fed tasked with pursuing both “stable prices” and “maximum employment”, there can occasionally be divergences where the Fed board must choose which goal to pursue. Is the Fed in a position to turn its attention to “maximum employment”, IE the strength of the economy, when inflation has not yet been minimized?
We maintain that the Fed may end up cutting fewer times than projected in late-2025/early-2026, but that this will be entirely inflation dependent. If costs tick higher, the appetite for cuts amongst the voting members of the Fed Board will recede. This is presently the biggest risk for the market as investors are feverishly pricing in these rate cuts (hence the recent market overperformance). If those don’t materialize, at a minimum the market will give up part of its recent rally.
The M2 Money Supply, as tracked by the Federal Reserve, is a measurement of all cash, checking and savings deposits, and money market funds. Through various mechanisms, the Fed controls the amount of money in circulation. In a sentence, the theory is that money supply should grow at pace with GDP to maintain a cost equilibrium. During periods of an overheated economy, the supply should be contracted, while during a tough economy the supply of money should be expanded.
Money supply surged at unprecedented rates following the Covid pandemic (see chart below), and the explosion in liquidity was largely responsible for the inflation that followed (a much larger pool of money was chasing the same amount of goods). The Fed then embarked on a campaign to tighten the money supply. This largely coincided with an economy in2022 which nearly stalled out.
Since 2024, the M2 Money Supply has resumed expanding. This may have a minor-but-relevant correlation with the resumption of sticky inflation, though the timing of the two events don't sync up. We don’t view current Fed policy as “too tight” nor “too loose” with the caveat that the Fed may look to contract the money supply again if the recent uptick in inflation is persistent.

The Federal Reserve also measures Total Bank Credit (All Commercial Banks) as a dollar value of all loans and securities held by U.S. commercial banks. While bank lending can expand during a recession, it tends to do so at a much slower rate when banks are worried about getting a return on their investment. Tightening credit is one of the major hallmarks of an economic slowdown. Fortunately, we don’t see any weakness here. Over the last twelve months, extended bank credit has climbed from $17.8 trillion to $18.7 trillion. This roughly 5% increase is consistent with a mid-range economic expansion. For reference, Total Bank Credit contracted during the Great Recession, surged as high as 12% during the early 2000’s boom-and-bust cycle, and tends to pace around 3-6% during periods of economic expansion.
Among other factors, there are two key components of market fundamentals that we track on a constant basis; both related to corporate strength in earnings. Using both projected and historical data, we analyze market cost using common stock metrics such as price-to-earnings ratios. We also study corporate profit from both a gross revenue standpoint and an earnings-per-share (EPS) basis. We additionally track many short-term indicators that are occasionally relevant in depicting the status of the economy.
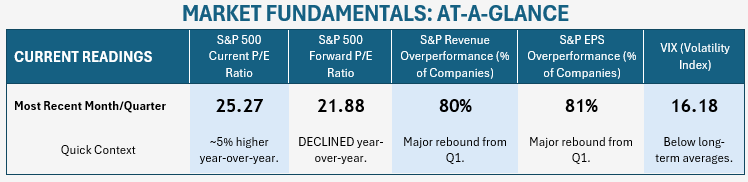
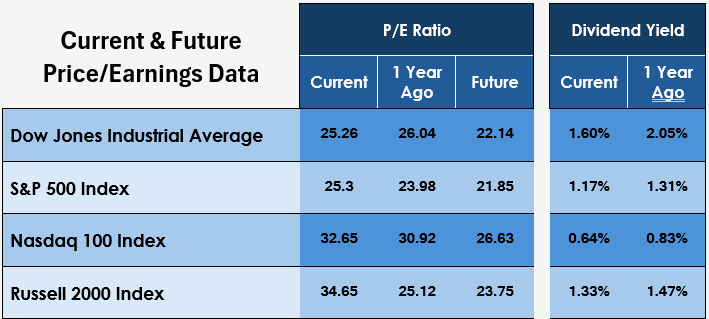
As a current indicator, it is fully accurate to describe stock values as becoming more expensive. We don’t disagree with that narrative in the main. Based on current earnings, the Current P/E Ratio of the S&P 500 has climbed to 25.27. One year ago, the same metric was 23.98. This means that, even after accounting for strong earnings growth, stocks are about 5% more expensive than they were a year ago.
Is this a reason to sell? Not necessarily.
Instead of basing it on current earnings, consider the same metric based on expected future corporate earnings (projected one year into the future). The Forward P/E Ratio of the S&P 500 has actually declined year-over-year. The current metric of 21.88 is, first, not as lofty as the current ratio (25.27). This is relevant as, even though the “current” ratio is the one that gets airtime on TV, you don’t buy a stock based on what the company is earning today. You buy it based on what you expect their earnings to grow to in the future. When we prepared a snapshot of the economy last October, this forward ratio was at 23.52. Surprisingly, on a basis of future expected earnings, stocks are actually 7% cheaper than a year ago.
How should this be interpreted? Even while companies meet and exceed current projections, the expectations of future corporate earnings are climbing. As companies perform well, projections for future earnings are being raised by analysts. This—analysts struggling to keep up with earnings growth—is another typical sign of a bull market. Eventually, projections become too lofty and companies begin to underperform, indicating the end of the cycle. The bottom line is that it is a mistake to simply accept the headline that stocks are getting “too expensive” without further analysis.
To return to recent earnings, the reason that stock prices have been climbing over the last quarter is straightforward. During the last “earnings season” (the quarterly period in which companies announce their performance), the average company massively overperformed expectations. This was a relief to investors as the previous quarter showed mixed-to-slowing results relative to expectations (again, a typical sign of an economic peak).
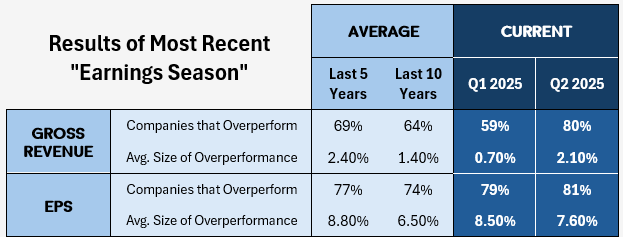
The massive success may be a little overstated. In the months leading up to earnings announcements, analyst expectations were, on average, repeatedly downgraded (primarily over concerns regarding tariffs and inflation). The hurdle was essentially lowered.
Nonetheless, the overperformance was significant. In the first quarter of 2025, only 59% of companies beat their Gross Revenue expectations, and they only did so by an average “beat” of 0.7%. The 59% figure put the market on edge as this was worse than the historical average for the last five years (69%). However, in the second quarter (the most recent to report), 80% of companies beat expectations by an average margin of 2.1%. Where stock values climbed last quarter, these numbers explain it.
On the basis of Earnings-Per-Share expectations, stock performed similar to the prior quarter. 81% of companies beat expectations, compared to 79% in Q1. The average magnitude of the beat was down, from 8.5% to 7.6%.
The clear conclusion from all of these numbers is that, while stock prices continue to climb, there are clear fundamental reasons for it. On a current-earnings basis, stock valuations are further stretched. However, as long as businesses continue to overperform expectations, as they have been, it will push projections for future profits higher—and that is what the investor should base stock prices on. In short, stocks have climbed for good reason.
Some other relevant data parsed from Q2 earnings calls:
Looking forward to third quarter earnings, the S&P 500 is expected to post year-over-year EPS growth of 7.9% (and 6.3% revenue growth). Expectations have been rising (the EPS projection was 7.3% at the start of the quarter). Tech sector expectations, in particular, have been climbing.
While one hallmark of a slowing economy is the market hitting the point where companies can no longer match expectations, there is no reason to think that is the case today. In fact, expectations for the third quarter, while increasing, are still lower than they were at the start of the year. “The bar” which companies are to jump over has been raised recently but lowered for the year.
In short, for third-quarter expectations, we anticipate that the majority of businesses will overperform expectations, but specific net earnings pressure will be seen in sectors which are more affected by inflation and tariffs (such as consumer staples).
Despite the narrative of stocks being “overvalued” we are more optimistic about the economy and stock market than we were a quarter ago.
Out of the dozens of economic data points that we track persistently, the vast majority are positive. As a form of conclusion, it’s easier to summarize our concerns in the economic data:
Of these, the creep in employment numbers is the most concerning as U6 employment has been inching higher for the last two years. However, it must be remembered that the current read (8.1%) is still lower than the average of the last fifteen years.
While stocks would benefit from a “healthy correction” (a selloff of up to 20%) at some point, it seems unlikely that such a contraction would happen in the immediate future. Studying historical data, it is uncommon for stocks to retreat during a period in which the Federal Reserve is reducing the Fed Funds Rate.
The most likely scenario for the rest of the year is for stock value movement to keep pace with corporate earnings. If companies can overperform expectations again, stocks will rally in solidarity. If companies can’t top estimates, stocks will retreat. With overperformance in current profit and/or increases in future projections, “current earnings” multiples will continue to expand (relative to future earnings).
Stocks earnings coming in above forecast and assumed continued Fed Rate Cuts, combined with typical seasonal performance (the latter months of the year are typically favorable for the stock market) could lead to the S&P 500 climbing several additional percent by the end of the year.
With low volatility, strong lending liquidity, and an expanding economy as the backdrop, right now it really does feel that simple.
We maintain a series of allocation models for our clients and universally use the S&P 500 as a primary benchmark. The models are often allocated to mirror the composition of the S&P 500 while also adding some diversification into foreign stocks and small-cap companies.
As mentioned earlier in the report, during the course of the last quarter our models moved from a “risk-neutral” position relative to the S&P 500 to being slightly more risk heavy than the index.
We quantify this risk by comparing the composition of the S&P 500 and highlighting areas we are comparatively underweight or overweight. More specifically, we over-allocate toward “growth” areas during times of economic expansion, focusing primarily on the faster-growing market sectors of Technology, Communications Services, and Financials.
For example purposes, we use our “Maximum Growth” allocation, which generally holds between 90% and 98% in stocks. The remainder is a small hedge of bonds or cash.
Correspondingly, we are slightly underweight in the categories of Real Estate, Consumer Cyclical, Energy, Healthcare, and Consumer Defensive.
Moving into the final quarter of the year, based on our renewed (and positive) outlook, we anticipate edging further into “growth” areas as appropriate, and in measured steps.
A few final summary notes for the quarter:
Our monthly Market & Economic Framework provides an overview of the market and economy, along with a brief future outlook. Subscribe to receive a copy monthly in your inbox!

Our quarterly Market Outlook & Economic Forecast

Clients often wonder how the market can "just keep going up". One of the answers is the "creative destruction" which the market is constantly undergoing.

At Lifetime Retirement Partners, we’re here to help you navigate your financial journey. Let’s create a personalized plan that aligns with your goals and adapts as your life evolves, providing you with confidence and peace of mind along the way.
Sign up for our newsletter and weekly mailings.
Osaic Form CRS
Check the background of your financial professional on FINRA's BrokerCheck.
The content is developed from sources believed to be providing accurate information. The information in this material is not intended as tax or legal advice. Please consult legal or tax professionals for specific information regarding your individual situation. The opinions expressed and material provided are for general information, and should not be considered a solicitation for the purchase or sale of any security.
We take protecting your data and privacy very seriously. As of January 1, 2020 the California Consumer Privacy Act (CCPA) suggests the following link as an extra measure to safeguard your data: Do not sell my personal information.
Securities and investment advisory services offered through Osaic Wealth, Inc. Member FINRA/SIPC. Osaic Wealth is separately owned and other entities and/or marketing names, products or services referenced here are independent of Osaic Wealth. This communication is strictly intended for individuals residing in the state(s) of AZ, CA, CO, FL, GA, IA, KS, MD, MO, NE, OK, SD, TN, TX, WA, WY. No offers may be made or accepted from any resident outside the specific states referenced.
This site is published for residents of the United States and is for informational purposes only and does not constitute an offer to sell or a solicitation of an offer to buy any security or product that may be referenced herein. Persons mentioned on this website may only offer services and transact business and/or respond to inquiries in states or jurisdictions in which they have been properly registered or are exempt from registration. Not all products and services referenced on this site are available in every state, jurisdiction or from every person listed. This website is not an offer to buy or a solicitation to sell securities.

