
Drafted 10/04/2026
Published 10/09/2026
Download the PDF version of our report HERE.
EXECUTIVE SUMMARY
- Stocks were mixed for the quarter, with the S&P 500 modestly appreciating but other indexes, such as the small-cap Russell 2000 or representations of foreign equities contracting.
- On September 16th, the Federal Reserve hiked its Federal Funds rate for the first time since 2023. This has been the primary catalyst for value declines in long-term bond funds, along with more interest-sensitive equities such as small-cap or dividend stocks.
- Long-bond yields spiked in the final weeks of September. While we discuss several contributing factors herein, we believe that the largest factor is the new hawkish position of the Fed regarding inflation.
- We describe the situation with Iran as one of “nervous equilibrium” which the market has begun to look past. While oil prices remain elevated, supply has partly rebounded.
- Corporate earnings continue to be exceptionally strong, and forecasts project this to continue.
- On a forward-earnings basis, stocks finished the quarter at one of their cheapest multiple valuations of the last three years. While stocks have generally gone up in value, they have done so slower than their earnings have grown. Multiples have contracted.
- We still believe that the American economy is expanding and is in the middle stage of a bull market.
- Macroeconomic indicators continue to look especially strong.
- GDP is projected to reach its strongest level of the year in the third quarter, and Gross Output just reported its strongest level in several years.
- The manufacturing and service sectors of the economy continue to expand. Manufacturing had been in contraction in 2025.
- We also see continued economic strength in macroeconomic data points such as Truck Tonnage Shipped.
- In the face of expected tightening, the labor market has stabilized and expanded in 2026.
- Bank lending continues at a rate indicative of a healthy and growing economy.
- The biggest issue in the economy remains persistent, sticky, and even accelerating inflation. Consumer sentiment also continues to be deeply negative, which we associate with inflation causally.
- The housing market also continues to struggle, which certainly will not be aided by rate hikes.
THIRD-QUARTER PERFORMANCE
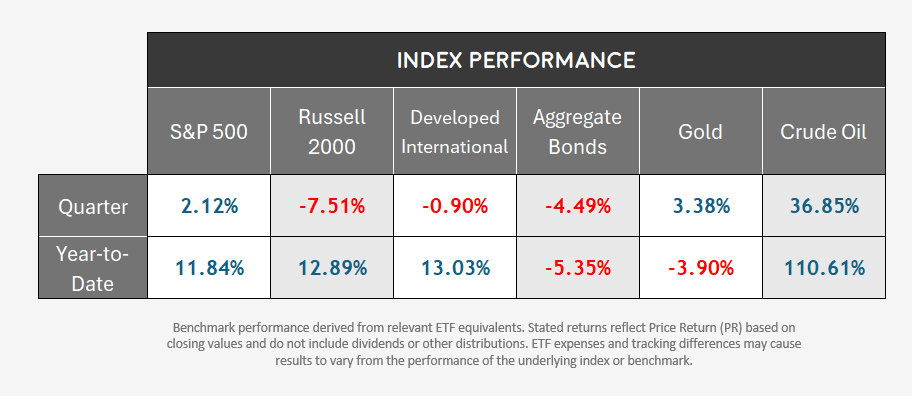
Stocks, in the main, have performed well so far in 2026. However, given the sharp movements in commodities and bond yields, the year thus far has been defined by constant rotation between sectors and asset classes.
Year-to-date gains are seen across equities, with appreciation greater than 10% in large-cap, small-cap, and foreign indexes. Most of the appreciation came in April through June, with a largely sideways market since. Small company stocks, as measured by the Russell 2000, pulled back meaningfully in the third quarter. Once well ahead of the S&P 500 for the year, they have now come into parity.
Oil, volatile in its reflection of Iran-related headlines news, is up over 100% for the year (as measured by the United States Oil ETF, ticker USO) and 30% for the quarter. This adds to inflation pressures.
Bonds have struggled since the initiation of the Iran conflict, pressured additionally by sticky inflation and a suddenly hawkish Fed (to be discussed at length shortly). While the broad Aggregate Bond Index (as measured by the iShares Core U.S. Aggregate bond ETF, ticker AGG) is down over 5% for the year, the longer-term 20-plus-year treasury bond ETF (ticker: TLT) has fallen over ten percent for the year: the worst performance in long-term bonds since 2022.
A MID-CYCLE BULL MARKET
The economy remains in a period of economic expansion. A worthwhile question isn’t whether this is the case, but how far we are through an economic growth cycle. With many of the data points which we track indicating a positive environment, we have come to believe that we are in neither the early nor later stages of an expansionary cycle.
There is always some weakness in the data. Economic indicators are almost never all positive or all negative, and the larger the pool of data the more likely some divergence becomes. Economists and Investment Managers are primarily looking for degrees of concern; in what direction, and by how much, does the data lean?
Current economic characteristics which suggest a healthy, “mid-stage” bull market:
- Continued economic expansion as measured by Gross Domestic Product (GDP) or Gross Output (GO) data.
- Companies consistently overperforming profit expectations (analysts struggle to keep up with the growth).
- Consistently low stock market volatility compared to either earlier in the “bull market” cycle or in the later stages of it (though this has been clouded by the Iran conflict).
- Sufficient, and even expansionary bank lending (towards the extremes of economic cycles, banks tend to lend more cautiously).
- Stable or expansionary employment conditions which can support consumer demand.
- Stable household balance sheets combined with expansionary spending patterns.
Economists look closely for signs of an economic peak, which are largely the inverse of the prior bullet points. To name a few:
- A reversing trend in employment, especially in new jobless claims.
- Deterioration in bank lending / credit availability.
- Widening credit spreads (the cost of financing starts climbing to finance less creditworthy debt).
- Consumer stress building: climbing outstanding debt / rising delinquency rates.
- Corporate earnings revisions peak and end of cycle of outperformance.
- Rising market volatility / market leadership narrows.
IRAN CONFLICT
America continues to be involved in a conflict with Iran which has dominated geopolitics for much of 2026. It has been the predominant cause in the spike of oil prices and has contributed to global inflation. However, by the end of the third quarter, the conflict has moved into a sort of nervous equilibrium which has caused the market to start to look past it.
While Iran continues to claim control of the Strait of Hormuz, including the supposed right to charge transferring ships for “protection” (in the form of tolls, fees, or whatever other euphemism is deployed), the nation’s capacity to enforce such a mechanism has been depleted. While Iran still retains the ability to initiate “maritime incidents” including an estimated fifteen in September (the highest since the early stages of the conflict), those incidents continued to amount to declining levels of effective, actual disruption.
While the price of oil remains elevated due to perceived continued risk, September Golf oil exports reached 19.2 million barrels per day (81% of pre-war levels). Crude and condensate exports recovered to 91% of pre-war levels, with flows briefly exceeding pre-war rates late in the month. The U.S. military presence, alternative routing, Saudi pipeline capacity, ships operating without normal AIS transmission, and adaptation by Gulf exporters have progressively reduced Iran's ability to choke off regional energy exports.
The current quasi-stasis requires continued United States military presence and enforcement in the area, and the unknowable is how long that will last. For as long as the conflict is under the status quo, with Iran claiming control but experiencing declining levels of enforcement leverage while the United States claims to want out of the conflict while refusing to capitulate to Iranian demands, we view the most likely forward scenario as this: oil prices will continue to slowly repair themselves as the world develops shipping workarounds (something that the free market is excellent at, given time).
While we do believe that the conflict has had partial causation in the increase in domestic inflation readings in 2026, that effect should diminish over time if the current equilibrium persists and energy markets continue to adapt.
INFLATION
After a sharp does of inflation impacted the American economy, peaking in 2022, core Personal Consumption Expenditures (PCE) inflation—the measurement most closely watched by the Federal Reserve—maintained a gradual decline through mid-2025. Much was written (correctly, as it turns out) about the remaining inflation being “sticky” and that the cycle of Federal rate cuts in late-2025 may have been premature since the Fed hadn’t actually reached its 2% target.
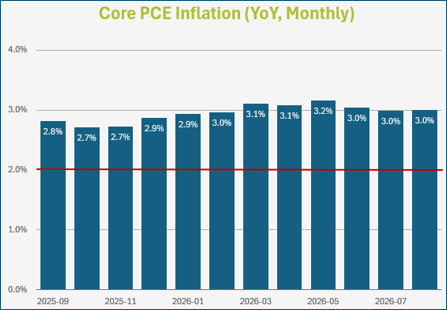
For the second half of 2025, inflation was stable; not climbing but no longer dropping. PCE inflation then began to reassert itself, jumping to an annualized growth rate of 2.87% in December of 2025. Note that, while we view it as an aggregating factor, inflation began to rebound before the conflict with Iran had initiated.
Currently at 3.01%, PCE inflation has now spent the majority of 2026 back above 3%.
While we can’t go into a full dissection here, our basic inflation framework divides inflation into two categories: transitory or short-term inflation and longer-term inflation. Short-term inflation is associated with one-off events—the Iran conflict may be an example—that impact immediate prices through supply chain disruptions. Those events either come to an end or are eventually corrected by the market. Longer inflation is primarily a consequence of money supply: if an increasing pool of money (or increasing demand) chases a static volume of goods, everything becomes more expensive.
Possibly contributing to long-term inflation stickiness is the recent acceleration of the M2 money supply (along with the late 2025 end of a Quantitative Tightening program). Paraphrasing the Federal Reserve database definition, M2 measures the balance of all “savings deposits…, small-denomination time deposits, and retail money market funds.” In short, the M2 calculation is an attempt to measure the amount of money in circulation. The Federal Reserve plays a part in that amount as it can remove or release funds into the system through its balance sheet. Government deficit spending can also be associated, but only to the extent that it equates to funds directly released into circulation.
The M2 money supply contracted in 2023 and 2024, the period where inflation declined the most. It stabilized, but stopped declining in 2025 (again, as did inflation). The M2 money supply has accelerated over the course of 2026, again repeating the moves in inflation. Current expansion at an annualized rate of 5.3% is the fastest since 2022. The expansion of money in circulation is almost certainly one contributing factor to the rebound of inflation seen in 2026. Note that this isn’t to imply a one-to-one causation: M2 expansion has been high during periods of low inflation. Recent inflation reacceleration isn’t exclusive to a simple oil shock, persistent economic demand, or loose monetary policy, but likely a convergence of several factors. More directly, in our framework, it is potentially a combination of long-term and short-term inflationary factors.
Unless inflation pressures suddenly diminish, the Fed is likely to go through an additional cycle of tightening in coming months. This may not relate exclusively to activity in the Federal Funds Rate. It may involve other methods of Federal balance sheet revision or tightening. All would be intended to add weight to the economy.
FED FUNDS RATES & BOND YIELDS
The last few weeks of the third quarter of 2026 saw bond yields spike dramatically. In our view, this was not caused by a single event but a convergence of contributing factors causing the market to worry. That concern translated as spiking bond yields.
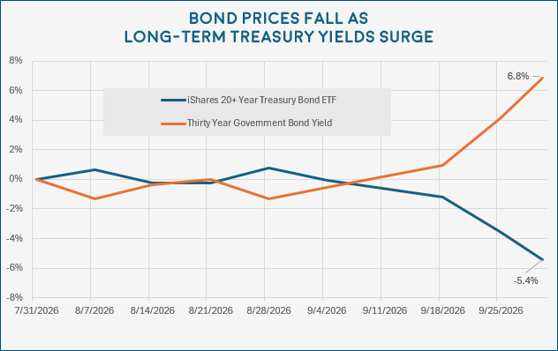
Some of those contributing factors have already been discussed: inflation generally, along with the Iran conflict and its economic impact. There are also growing concerns with the level of government debt; especially the constant issuance of new debt. The remaining, and perhaps largest contributing factor, is the Federal Reserve itself.
The Federal Reserve’s mandate is to target “maximum employment, stable prices, and moderate long-term interest rates”. In simple language, they are responsible for maximizing economic activity (through maximum employment) while keeping inflation in check. As we have written before, these are goals that are sometimes at odds and the tension in the bond market can be connected directly to that conflict.
New Federal Reserve Chairman Kevin Warsh has come out as much more hawkish over inflation than expected. Regarding inflation, during a speech at Jackson Hole (August 28th), he initially alerted the market to his concern over inflation:
“Price stability is not self-executing, nor is inflation necessarily mean-reverting. It is the Fed's job to deliver stable prices… the responsibility for 65 months of sustained, elevated inflation sits squarely with the central bank… We must be confident that underlying inflation is moving to our objective, clearly and at sufficient speed. Otherwise, we have work to do.”
It was at this point where long-term treasury yields started to rise. While his comments were more “hawkish” than expected, there was little to debate in his core message that inflation is the Fed’s concern, and that inflation wasn’t where it was supposed to be.
During his press conference on September 16th, the day the Fed hiked interest rates by 0.25%, part of Chairman Warsh’s opening remarks focused on how the new interest rate hike was necessary in the face of a strong economy. He said, “Our decision comes at a time when the American economy appears to be strengthening.” He cited strong private-sector earnings, business investment and productivity.
Warsh also forecasted additional rate hikes in his message when he said that he would, “be hard pressed to describe broad financial conditions as restrictive”. This seems to imply that financial conditions are not restrictive—or even neutral. It also seems to imply that a cycle of rate hikes (or other Fed tightening) is forthcoming to get the Fed into the “restrictive” range it desires to combat inflation.
This is where the market may be finding a conflict in the “dual mandate”. If the economy is “strengthening” (using Warsh’s word), but so is inflation, the bond market may presently be surging at the realization that the Fed intends to tighten the economy meaningfully to combat said inflation.
None of this is a permanent course, but a current read of expectations. This may be why the stock market has held up reasonably well in the face of an alarming surge in bonds. While, again, we see its effect as waning, the Iran situation continues to impact oil, which continues to impact inflation. Combined with monetary policy which is perceived to be loose (perhaps correctly), it sets up an increasingly challenging recipe in which a resilient economy must continue to perform.
ECONOMIC FRAGILITY & MARKET MOMENTUM
We have developed and maintain two separate indices which inform investment positioning. One tests market momentum while the other evaluates economic fragility.
VOLATILITY & STOCK MOMENTUM

The Lifetime Momentum & Volatility Index (LMVI) is a short-term investment and volatility framework which tracks four key market indicators across roughly a dozen screening formulas. Out of the four components in the index, two are market/momentum based while the other two relate more to credit and economic strength. Together, they help distinguish between ordinary market volatility and periods of elevated systemic risk. The model is intentionally designed to be slow-moving and should only issue a meaningful warning a handful of times during a typical year. It reports on a scale of -4 (risk-off) to +4 (risk-on).
After turning negative earlier in the year, leading up to the Iran conflict and AI-related investment declines, the indicator had climbed to neutral by April 3rd—right at the market bottom—and has consistently returned a positive score since April 10th. The current score is +2.
Download the most recent LMVI data asa PDF HERE
ECONOMIC FRAGILITY
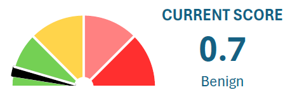
The Lifetime Early Warning System (LEWS) is intended to diagnose economic fragility.
Its eight components are forward-looking economic and market indicators. These include yield curve tests, jobless claims, bond spreads, defensive market rotations, and bank lending. Unlike our volatility index, LEWS is attuned to be highly sensitive and rise at the first sign of stress.
On a 0-10 scale, the indicator currently has a mild score of 0.7 (categorized as “Benign”). This is the lowest score of the last 52 weeks.
The Early Warning System score ticked up slightly during the Iran conflict, briefly touching 2.8. However, it has scored in the “Benign” category for most of the year. The indication of low economic fragility helps to factor against taking a defensive posture with investments.
Download the most recent LEWS Report HERE
STRENGTH-OF-CONSUMER INDICATORS
View our most recent Consumer slide deck HERE
Our study of consumer strength tracks nearly a dozen data points and splits cleanly into two sub-indices:
Labor Market Strength includes key indicators such as unemployment data, job openings, (voluntary) job quitting, payroll growth, and jobless claims.
Consumer Health reflects the balance-sheet strength of households. Factors include debt levels, delinquency trends, and the purchasing power of wages.
LABOR MARKET STRENGTH
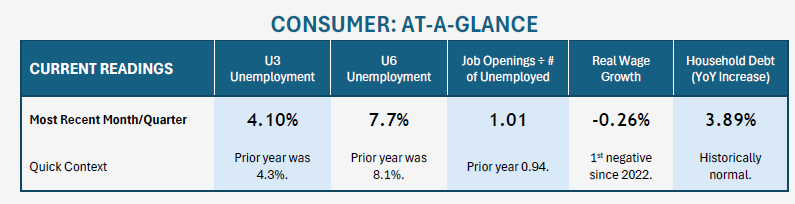
Earlier this year, we wrote about a “labor market [which] is defined by both low hiring and low job loss”. While that characterization still largely holds true, 2026 is also defined by an employment market which has improved over the last year after showing some weakness.
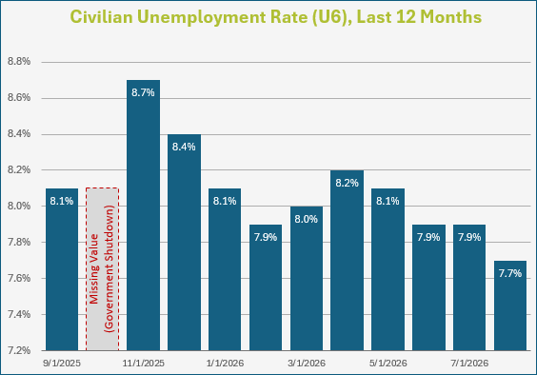
When tracking the labor market, our favorite indicator is the U6 Unemployment Rate which, after spiking last November to 8.7% (the highest level since 2021), has steadily improved as 2026 has progressed. The value, at 8.1% one year ago, has now declined to 7.7%. It is now near the average of the last five years (7.45%).
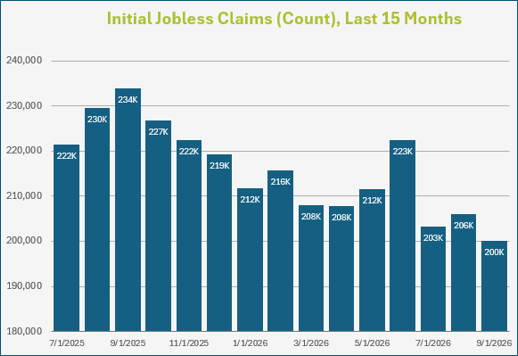
Another key labor indicator which economists track as forward-looking/predictive are Initial Jobless Claims. They measure the number of individuals filing for unemployment benefits for the first time, providing a timely indicator of labor market conditions. Despite expectations from some economists that claims would begin to rise, they have actually edged lower over the past year, with the latest reading at 197,000.
CONSUMER HEALTH
We don't completely dismiss the popular narrative of a "K-shaped economy," where persistent inflation has disproportionately affected lower-income households. Even so, we believe the broader "stretched consumer" narrative has become somewhat overstated.
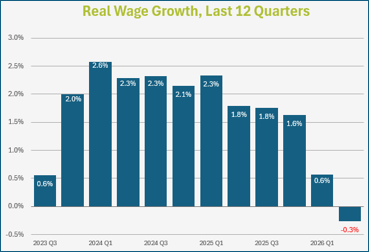
Real Wage Growth faltered during “peak inflation”, running negative for about two years. Since then, even with continued persistent inflation, wages outpaced inflation for twelve straight quarters—three years—before turning slightly negative last quarter. If it persists, continued negative wage growth will wear increasingly heavy on our model.
Total Consumer Credit Outstanding, a measurement of all consumer indebtedness (including mortgages, credit cards, student loans, etc.), has climbed by 3.89% over the last year. While this is the fifth straight quarterly increase, it is also a historically typical figure (the average for the last five years is 4.92%). For context, it is normal for Consumer Credit to climb over time. It only becomes concerning when debt growth begins accelerating materially or outpace wage growth.
Credit Card Delinquency Rates are also fractionally lower than one year ago (2.85% vs. 3.04%).
Consumer spending remains the backbone of the U.S. economy. The data continues to show healthy spending activity, but importantly, that spending is not currently financed by a rapid increase in household debt. Taken together, the broader picture remains one of a consumer that has proven considerably more resilient than many expected.
MACROECONOMIC INDICATORS
View our most recent Macroeconomic slide deck HERE
We track numerous macroeconomic indicators which can generally be broken down into two categories: Economic Growth and Inflation. The factors continue to depict an economy which is strong coupled with sticky inflation which began to reassert itself in late 2024.
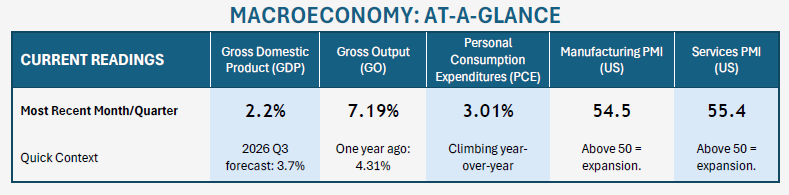
While inflation remains an issue for the American economy, almost all of the other macroeconomic indicators which we track indicate a stable trajectory of growth. This is true with broad economic estimates (GDP or Gross Output), sector estimates (manufacturing or services) and shipment data (such as Truck Tonnage Shipped or Industrial Production measurements). Almost all report strength.
ECONOMIC GROWTH
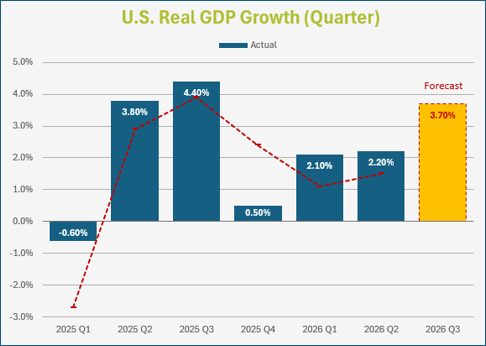
The Federal Reserve Bank of Atlanta publishes the GDPNow forecast which estimates Gross Domestic Product (GDP) growth in real time as each quarter progresses. Where they projected that the second quarter of 2026 would reach 1.50% annualized growth, the actual final result for the quarter was stronger GDP growth of 2.20%. The forecast for the third quarter is currently 3.7%, which would make it the strongest score of the year.
In addition to GDP, we also emphasize Gross Output (GO) as a broader gauge of economic activity. Similar in concept to GDP, it captures total sales across all industries, including both final goods and services and intermediate inputs.
The most recent Gross Output data shows year-over-year growth of 7.19%, the strongest value since 2022. Before the recent acceleration, Gross Output had been between 4.2% and 5.2% for each of the last eight quarters, already depicting stable economic growth not seen in GDP.
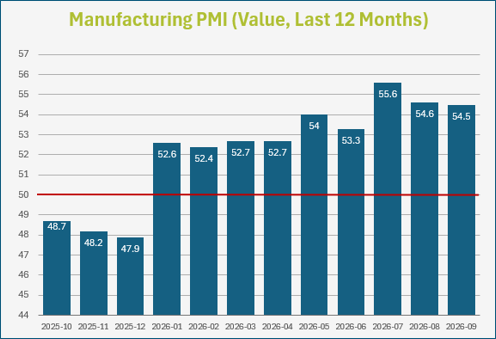
The Purchasing Managers’ Index (PMI), compiled by the Institute for Supply Management (ISM), conducts surveys with purchasing managers regarding orders, production, and employment. They are a leading indicator of economic health. We track both the Manufacturing and Service sectors. In this data, 50 is the watermark value. Under 50 indicates a contraction, while values over 50 indicate expansion.
The Services indicator includes categories such as Finance, Healthcare, and Retail, and makes up over 70% of the economy. Recent readings have been predominately positive (only one negative month in over two years) and the current level of 55.4 indicates strong continued expansion. ISM’s semiannual forecast projects continued expansion in 2026.
Manufacturing PMI figures, which spent most of 2024 and 2025 in a contraction, have shown a sudden rebound in 2026. While a return to expansion was expected at some point (ISM’s Fall 2025 Semiannual Forecast said manufacturing supply managers expect overall growth in 2026 and are “more excited about faster growth in the second half”) it was surprising to have the rebound suddenly upon us. Prior to 2026, only two of the previous forty-eight months had been positive.
INFLATION
Core Personal Consumption Expenditures (PCE) inflation reported most recently at an annualized growth rate of 3.01%. In addition to remaining more than 50% higher than the Fed’s 2% target, it is the sixth straight monthly reading above 3%. This reasserting inflation is perhaps the biggest current problem with the American economy (and likely a major factor in why consumer sentiment remains deeply negative).
The persistent inflation has led the Federal Reserve to hike interest rates in September for the first time since 2023. This seems likely to be the initiation of a cycle of several rate hikes.
See the prior section “Inflation” for additional commentary.
MONETARY INDICATORS
View our most recent Monetary slide deck HERE
To monitor the monetary condition of the United States economy—often analogized as the oil of an economic engine—we track roughly one dozen data points which can be broken into two broad categories: Federal Monetary Policy and Lending and Liquidity.
Federal Monetary Policy focuses primary on the movements of the Federal Reserve: both in its manipulation of the Federal Funds rate and the movements of the federal balance sheet. The Federal Reserve helps to set the table of economic conditions.
Bank Lending & Liquidity is one of the great early indicators of expansions and contractions. Almost every recession is presupposed by banks tightening their lending standards and volume. Banks go through cycles where they fear they are “missing out” by not lending more, eventually pivoting to times where they are restrictive and fear they won’t get their money back.
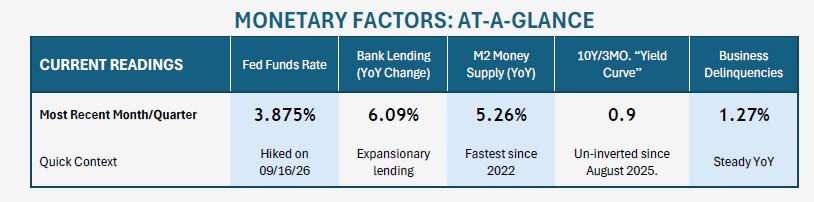
Progressing through 2026, monetary indicators point toward a stable-to-improving picture for the American economy. While still narrow, the yield curve is near its widest un-inversion in nearly three years and bank lending remains unrestricted.
FEDERAL MONETARY POLICY
See our prior discussion, “Fed Funds Rates & Bond Yields” for commentary on Federal Monetary policy.
BANK LENDING & LIQUIDITY
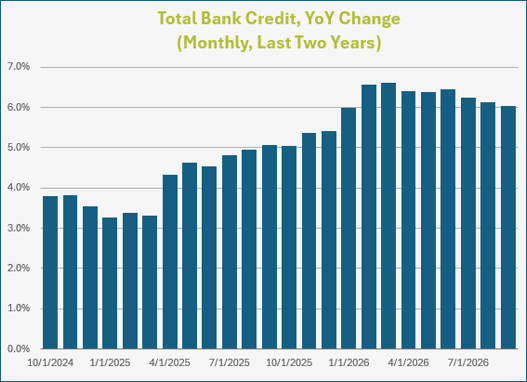
The Federal Reserve database measures Total Bank Credit (All Commercial Banks) as a dollar value of all loans and securities held by U.S. commercial banks. While bank lending can expand during a recession, it tends to do so at a much slower rate when banks are worried about getting a return on their investment. Tightening credit is one of the major hallmarks of an economic slowdown. Fortunately, we don’t see any weakness here. During the past twelve months, commercial bank credit has increased from $18.76 trillion to $19.85 trillion, a healthy 6.09% gain consistent with an expanding economy. For reference, Total Bank Credit contracted during the Great Recession, surged as high as 12% during the early 2,000’s boom-and-bust cycle, and tends to pace around 3-6% during periods of economic expansion.
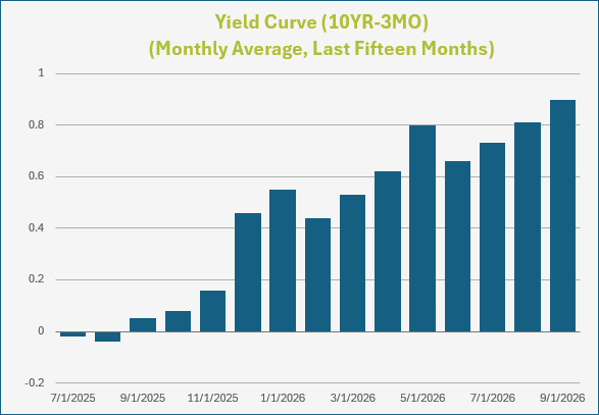
One of the most effective predictors of recessions (or, at least, of investor fear) is the inversion of short-term and long-term bond yields. While analysts use different ranges, we focus on the traditional yield-curve between three-month and ten-year treasuries.
The 2022–2024 cycle represents one of the rare instances in which the yield curve inverted without an immediate recession following. During 2025, the curve fluctuated between inverted and not dozens of times before finally trending toward normalcy in the second half of 2025. Presently, at the end of the third quarter of 2026, the yield curve is near the steepest un-inversion since 2022. While still flatter than during a typical expansion, it has remained positively sloped for nearly a full year and continues to normalize.
MARKET FUNDAMENTALS
View our most recent Market Fundamentals slide deck HERE
Our analysis of stock market fundamentals includes a framework for both long-term and short-term investment decision making.
Along with many other data points, to maintain a wide, macro concept of the investment market we monitor market-wide earnings ratios (focusing on the S&P 500 but studying many indices). We also monitor and search for trends in corporate stock performance as announced during quarterly earnings announcements.
We additionally maintain a proprietary short-term market momentum/volatility framework to establish pockets of immediate caution or optimism.
PRICE-TO-EARNINGS RATIOS
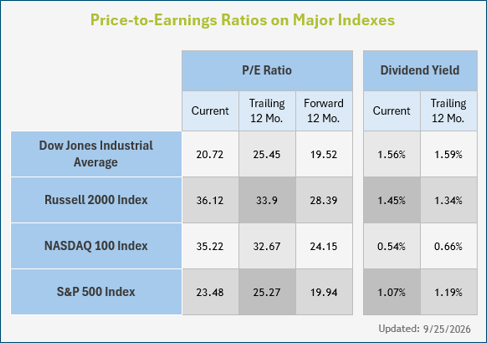
For much of 2025 and into 2026, the market has restrained itself from overpricing stocks. While there have been no major pullbacks in equities recently, the S&P 500 has experienced several minor retractions every time equites started to look “frothy”. In fact, not only have equity valuations stayed in check, but with companies experiencing expanding profits at a faster rate than stocks have appreciated, we have seen modest “multiple contraction” in equities. While stock prices have gone up, earnings have gone up faster. On both a “current” and “forward” basis, stocks are cheaper than they were one year ago.
While the “current” ratio is the one that gets the most publicity, stocks tend to be valued based on expectations of future earnings. Investors buy stocks based on what they expect companies will earn in the future, not what they earned in the past.
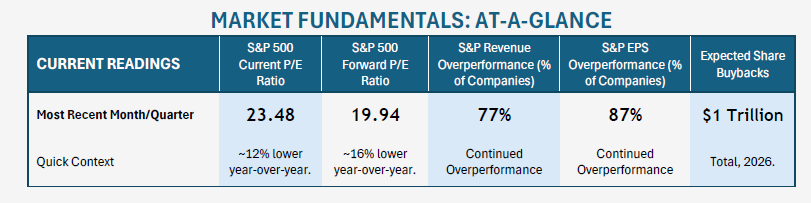
With an S&P 500 forward price-to-earnings ratio of 19.94, stocks finished September with their cheapest valuations of 2026. This is with the exception of a few days in March of this year (March 20th - 30th); just before the market staged a rally. In fact, forward-valued stocks were over 15% cheaper at the same time in 2025. They are currently amongst the cheapest levels since 2024 began.
The S&P 500 lost momentum at the end of September. While the headline value stayed afloat, there was a significant deterioration in market breadth underneath. By September 30th, only 20.5% of S&P stocks were above their fifty-day moving averages. This means that, while some larger stocks didn’t decline and managed to prop up the index, the average stock in the S&P 500 declined over that fifty-day period. This helps to explain how headline market multiples can continue to look cheaper, even as the index treads water.
Note that while stocks look theoretically cheap by the numbers, multiples tend to contract during Fed “hiking” cycles. This will not mean that stock values will go down but that, even with good earnings, stock prices may continue to expand at a slower rate than those earnings for as long as the hiking cycle continues.
EARNINGS SEASON
A hallmark of a bull market is corporate profits which are climbing faster than analyst estimates. Similarly, a hallmark of a market peak is when companies begin to fail to outperform expectations (as projections of growth become ever loftier). This is why investors look so closely at quarterly stock announcements.
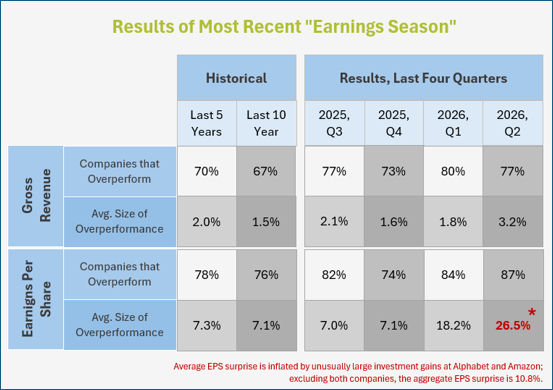
The recent Earnings Season, announcing company revenue and earnings per share for the first quarter of 2026, has seen historically massive overperformance—especially on the earnings side.
77% of companies overperformed revenue expectations and 87% beat net earnings expectations. The margin of overperformance was dramatic: revenue overperformance of 3.2% (well above the average of the last ten years) but earnings (essentially, net profit) overperformance of 26.5%. Even with distorting gains from Alphabet and Amazon removed, the margin of EPS surprise is at 10.8%; like revenue, well above the average of the last ten years.
Analysts remain optimistic about corporate profits for the remainder of 2026. Current consensus forecasts call for continued robust earnings growth, supported by revenue expansion, healthy profit margins, and broad participation across nearly every sector. Over the long run, sustained earnings growth remains one of the strongest drivers of stock prices.
CONCLUSIONARY FORECAST
The third quarter of 2026 concluded with a complex investment climate. It’s a significant factor in stock prices when the Federal Reserve suddenly starts to hike interest rates. This will likely lead to investors continuing to rotate away from trades which had been working earlier in the year (such as small cap stocks).
At the close of the quarter, we have been concerned about the sudden surge in long-term bond yields. As September ended, thirty-year yields were the highest since 2002. This is an indicator that the market is alarmed about something. Among several contributing factors, we believe that the primary point of alert is the newly hawkish position of the Fed which seems prepared to restrain a strong economy in the name of controlling inflation.
Nonetheless, many factors that we track are positive. The economy remains strong. The labor market has strengthened. Bank lending is favorable. Stocks, broadly, are at relatively attractive values, and there is little indication that earnings will suddenly start to disappoint.
While the upcoming Midterm election is a possible hurdle and the situation with Iran could suddenly deteriorate, we see the investment “base case” as the market having one more potential leg up this year to go along with continued strong earnings. As it has all year, pockets of volatility will likely persist, primarily during trading periods outside of “earnings season”. We would also repeat the caveat that, if the Fed continues hiking the Federal Funds Rate, it may stimulate a “new normal” where stocks continue to appreciate but at a slower rate than their earnings would suggest; multiples may continue to compress relative to stock prices. Markets tend to trade at lower multiples during periods of higher core rates (and/or during periods of higher inflation).
Securities and investment advisory services offered through OsaicWealth, Inc. Member FINRA/SIPC. OsaicWealth is separately owned and other entities and/or marketing names,products, or services referenced here are independent of Osaic Wealth.