our office locations


We conduct extensive research over dozens of data points to provide an economic and market outlook. Lifetime Retirement Partners works hard to analyze investment conditions and help set expectatons for our clients.

NOTE: This document can be downloaded as a PDF here.
MARKET PERFORMANCE
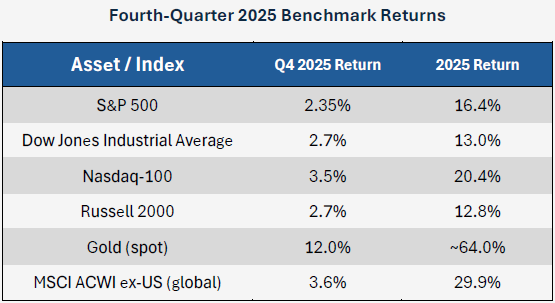
Though there was a surge in volatility in the final quarter of the year, 2025 was a positive year for most major investments.
The S&P 500 finished the year with a return of 16.4%, completing its third consecutive year of double-digit growth. The index stalled out in October as volatility climbed, vacillating in November and December and ending with a “Santa Clause” rally that fizzled. Nonetheless, it was a very successful year for stocks in general.
This includes foreign stocks, with the MSCI ACWI global index posting price gain of nearly 30%return. The foreign index edged out all U.S. indices for the year.
Gold was the big winner in 2025, up nearly 65%. Precious metals more generally surged, with record prices set not just for gold but for silver and copper as well. While metals struggled with a late-year sell-off, gold (and most other precious metals) posted their best year since 1979.
The economy remains in a period of economic expansion. A worthwhile question isn’t whether this is the case, but how far we are through an economic growth cycle. With many of the data points which we track indicating a positive environment, we have come to believe that we are in neither the early nor later stages of an expansionary cycle. As indicated by robust stock returns, we seem to be right in the middle of the “good times”.
There is always some weakness in the data. Economic indicators are almost never all positive or all negative, and the larger the pool of data the more likely some divergence becomes. Economists and Investment Managers are primarily looking for degrees of concern; in what direction, and by how much, does the data lean?
Current economic characteristics which suggest a healthy, “mid-stage” bull market:
TARIFF OVRHANG
We have written much commentary about tariffs in 2025 and provide only a brief discussion here related to the most likely future developments.
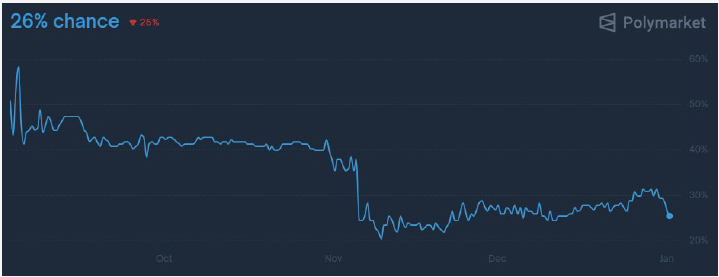
In November, the Supreme Court held hearings on the constitutionality of the Trump Administration’s use of tariffs as an “emergency power”. A majority of justices seemed inclined to side against the President. On the prediction market Polymarket, participants had been pricing in about a 40% chance that the tariffs would be upheld. That sank after the hearings and currently stands at 26%.
It’s most likely that the Supreme Court will clarify tariff powers as being limited to other, existing Congressional Acts such as the Trade Expansion Act of 1962. These grant the executive specific powers—especially in cases of a blanket industry tariff (such as a levy on steel). However, nation-specific tariffs or broad blanket tariffs, will likely not be permitted through the IEEPA.
Assuming this outcome, the market is likely to go through a one-time, transitory repricing as investors rally toward stocks which (no longer) face heaviest issues with tariffs. There will likely also be some momentary chaos if the High Court rules that collected tariffs must be repaid. The admin has also made clear that it will pursue a tariff regime through other avenues (such as the Trade Expansion Act mentioned above). These moves are unlikely to have the same bite (logically—if they did—they would have been used in the first place) but are an indication that tariffs aren’t simply “going away” as a subject.
There may be some repricing and confusion, but in the end the clarity resulting from the decision will be positive for the market and economy. As we often tell clients, the market can price anything; what it struggles with is the unknown.
Our study of consumer strength tracks nearly a dozen datapoints and splits cleanly into two sub-indices: Labor Market Strength & Consumer Health.
Labor Market Strength includes key indicators such as unemployment data, job openings, (voluntary) job quitting, payroll growth, and jobless claims.
Consumer Health reflects the balance-sheet strength of households. Factors include debt levels, delinquency trends, and the purchasing power of wages.
NOTE: Due to the 2025 government shutdown, a number of data points have not been updated. This report represents our best effort to extrapolate emerging trends given a combination of new and expired data.
In the aftermath of the Covid era, unemployment massively surged but then—almost as quickly—tracked to some of the lowest figures in history. Since 2023, lead unemployment figures have slowly ticked higher.
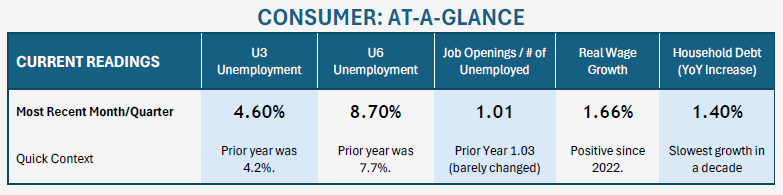
In studying unemployment figures, our preferred gauge is the U6 Unemployed Rate, as it includes not just those fully unemployed but also citizens “Employed Part-Time for Economic Reasons”. Currently at 8.7%, this unemployment rate has been ticking higher and was, one year ago, 7.7%. To provide some context, this has had a simple average of about 8.6% over the last ten years. It peaked at around 17% during the Great Recession and briefly spiked over 22% during Covid.
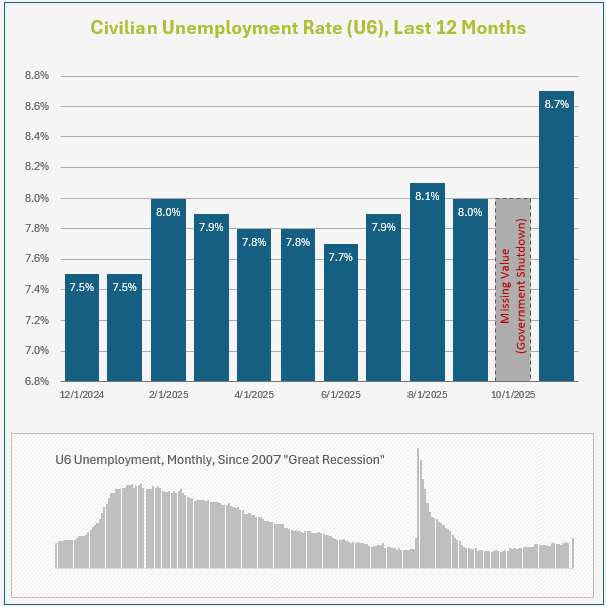
Unemployment figures are now trending above recent historical levels. We believe that this is the primary reason that the Fed has moved to cut interest rates while also concluding its Quantitative Tightening program in December.
While headline unemployment has been climbing, we highlight a number of countervailing points. First, unemployment claims for jobless benefits have not increased alongside it. In the final read of the year, initial jobless claims actually fell to 199,000, remaining near historically low levels and below expectations, signaling that employers have not broadly resorted to layoffs. In addition, statistics for new business formations have been surging. Business applications in November of 2025 (the most recent data) climbed 7.1% month-over-month. In the same date range, Projected Business Formations climbed 6.2%.
While, of course, further weakening of data will change the narrative, our current view of the labor market is that, while unemployment is climbing, individuals who find themselves unemployed are landing into an economy which remains healthy. Re-employment, and the ability and liquidity needed for new business formation remains at an acceptable level.
Real Wage Growth (wage growth above inflation) has been positive for over two years, though the last data point was released in the second quarter of 2025. The most recent data still depicts a stable, expanding economy. So does an analysis of Total Consumer Credit Outstanding. The test of consumer indebtedness has climbed by only 1.4% over the last year, indicating that consumers, at a minimum, are not stretched more than they were one year ago. This is the slowest annual growth in nearly a decade. Credit Card Delinquency Rates are also slightly lower than one year ago. Combine the data points: wage growth has outpaced consumer debt level increases over the last year.
All of the datapoints combined point to a split picture: a slowly softening—though not yet alarming—labor market, paired with a consumer who remains shockingly resilient.
We track a number of macroeconomic indicators which can generally be broken down into two categories: Economic Growth and Inflation. The factors continue to depict an economy which is strong but shows some signs of slowing around the edges, coupled with sticky inflation which began to reassert itself in late-2024.
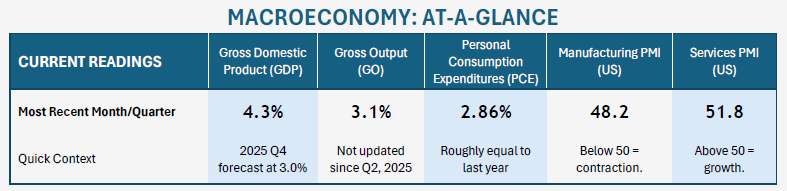
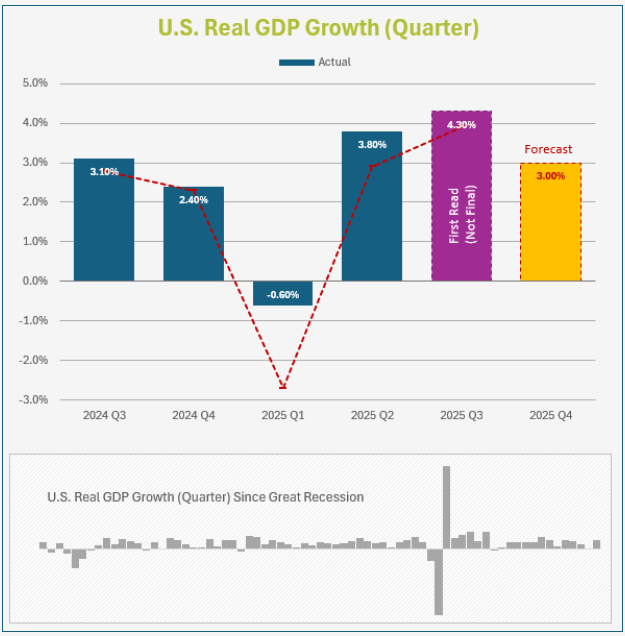
Gross Domestic Product (GDP) is a key measure of economic activity. It estimates total monetary value of all final goods produced in a nation. While GDP contracted in the first quarter of2025 (-0.6%), it rebounded substantially in subsequent quarters. A growth rate of 4.3% in quarter three of2025 was the highest expansion rate in several years.
One of our preferred forward-looking indicators is the GDPNow Forecast. Revised regularly by the Federal Reserve Bank of Atlanta, it projects the strength of the current quarter of GDP as it is happening. The indicator has a history of relatively accurate forecasts, including correctly predicting an economic contraction in Q1 of 2025. As the fourth quarter draws to a close, their current projection for growth in that quarter has surged to 3.0%. This compares to last year’s year-over-year increase of 2.4% and indicates steady-to-expansive growth in the economy.
The current consensus projection for full-year 2025 U.S. GDP growth is approximately 1.8% (source: Philadelphia Fed’s Survey of Professional Forecasters). This pace of growth is slightly below the average of the past five years (roughly 2%), but the shortfall is largely attributable to one weak quarter earlier in the year, rather than broad-based economic deterioration. Growth over the second half of 2025 has been materially stronger, supporting the view that the economy has remained in expansion despite periods of volatility.
Instead of measuring only the finished goods as GDP does, Gross Output (GO) measures the total sales or receipts of all industries in the economy. This includes both final goods and services and intermediate inputs used in production. While our methodology combines an analysis of Gross Output and GDP, a recent release of GO has not been provided due to the government shutdown. Therefore, our Q4 report leans solely on GDP.
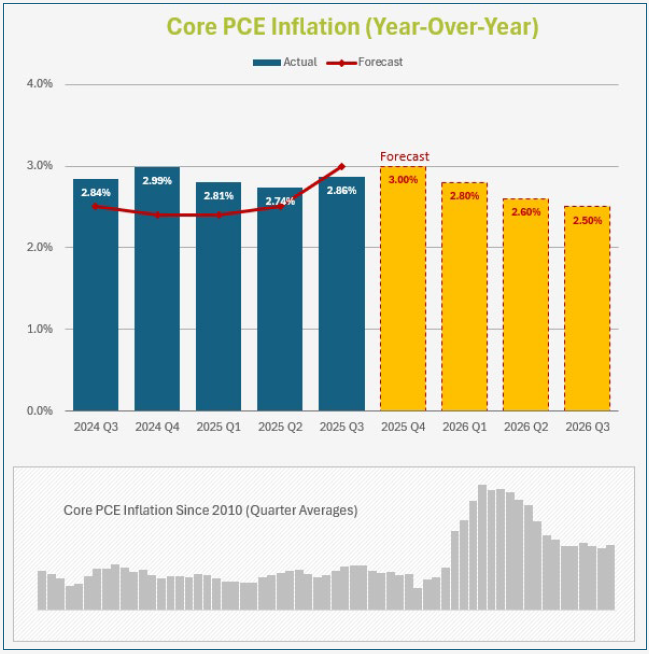
The Personal Consumption Expenditures (PCE) Price Index measures the average change over time in the prices paid by U.S. consumers for goods and services. The Fed prefers PCE over CPI because it has broader coverage than CPI and adjusts for changing consumer behavior (substitution).
At the same time that the Federal Reserve was initiating a campaign of rate cuts last year, inflation began to reassert itself in the later part of 2024. PCE inflation hit a low of 2.6% in mid-2024—drifting back toward the Fed’s 2% target—before beginning to rebound.
PCE inflation has statistically treaded water in 2025, moving down modestly for three quarters before ticking back up in the most recent release.
The Philadelphia Federal Reserve’s Survey of Professional Forecasters currently projects a reassertion of inflation in 2026. Expectations show the PCE mark ticking back up to 3% before drifting down again. This should be digested with hesitancy and the understanding that the most recent forecasts were published before the Q3 PCE inflation report (which came in below projections).
The Fed has recently initiated a series of two rounds of rate cuts (some in late-2024, some in late-2025) prior to reaching its inflation target. In our view, the Fed likely either believes that PCE inflation will resume a downward trajectory in coming quarters, or they feel that residual inflation will remain “sticky” regardless of a few quarter point cuts.
The Purchasing Managers’ Index (PMI), compiled by the Institute for Supply Management (ISM), conducts surveys with purchasing managers regarding orders, production, and employment. They are a leading indicator of economic health. We track both the Manufacturing and Service sectors. In this data, 50 is the watermark value. Under 50 indicates a contraction, while values over 50 indicate expansion.
The Services indicator includes categories such as Finance, Healthcare, and Retail, and makes up over 70% of the economy. The current level of 51.8 indicates modest growth and recent readings have been mostly positive (only two negative months in the last two years). ISM’s semiannual forecast indicates continued expansion in 2026.
At 48.2, Manufacturing numbers remain in the sustained contraction which it has been in for most of 2025. ISM’s Fall 2025 Semiannual Forecast says manufacturing supply managers expect overall growth in 2026and are “more excited about faster growth in the second half.”
MONETARY INDICATORS
To monitor the monetary condition of the United States economy—often analogized as the oil of an economic engine—we track roughly one dozen data points which can be broken into two broad categories: Federal Monetary Policy and Lending and Liquidity.
Federal Monetary Policy focuses primary on the movements of the Federal Reserve: both in its manipulation of the Federal Funds rate and the movements of the federal balance sheet. The Federal Reserve helps to set the table of economic conditions.
Bank Lending & Liquidity is one of the great early indicators of expansions and contractions. Almost every recession is presupposed by banks tightening their lending standards and volume. Just like the rest of us, banks can go through cycles from where they fear they are “missing out” by not lending more, eventually pivoting to times where they are restrictive and fear they won’t get their money back.
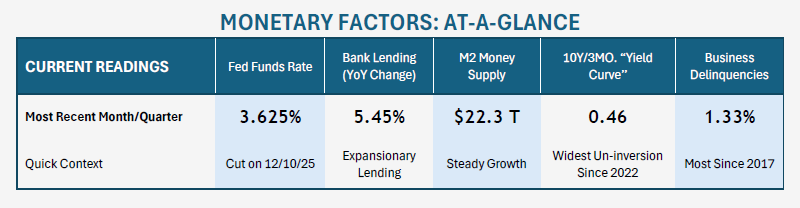
Moving into 2026, monetary indicators point toward a stable-to-improving picture for the American economy. Interest rates are dropping (which is stimulating for stocks), and, while still narrow, the yield curve is ending 2025 at the widest un-inversion in nearly three years. Bank lending remains unrestricted and money supply growth has normalized.
One of the primary components in how stocks are valued is the overall interest rate environment. Historically, one of the greatest catalysts for stock value increases isa reduction in the Effective Federal Funds Rate. The logic is straightforward: as rates drop on instruments like CDs, there is less competition for stocks. Also, lower rates directly impact the bottom line of stocks: the lower the cost of debt servicing, the greater the profit. Conversely, as rates climb, higher non-stock yields act as competition.
The Federal Reserve hiked rates multiple times in 2022 and 2023 in an effort to combat inflation, ultimately bringing federal lending rates to the highest level since before the Great Recession. As inflation slowed, the Fed cut rates by one full point in 2024. Rates moved from a target of 5.33% down to 4.33%. After a long pause, rate cuts resumed in 2025, reducing rates another three-quarters of a point to a current mid-range value of 3.625%. While this is still the highest rate in well more than a decade, it represents a roughly 25% overall reduction in just over one year.
The FedWatch predictor tool, which attempts to project future Fed changes, currently expects one-to-two more cuts in the first part of 2026. The estimator anticipates an 83% chance of at least one cut in the first half of the year and a 72% chance of multiple cuts during the coming calendar year. We maintain that at least one cut is likely, in an effort by the Fed to bring itself further toward a neutral (non-restrictive) interest rate.
However, we feel that the Fed is likely to then go into another extended “wait-and-see” mode where it pauses and monitors economic activity. Projections for multiple rate cuts are premature. The market frequently misses the fact that the Fed is calibrating based on lagging, historic data and is often looking for a long runway to provide new data which can inform future moves. In addition, it’s not our view that we are in an economy that desperately needs cuts. A strong and expanding economy is typically met with the “dry powder” argument: save additional rate cuts for when they are needed as a stimulant, not when things are running smoothly.
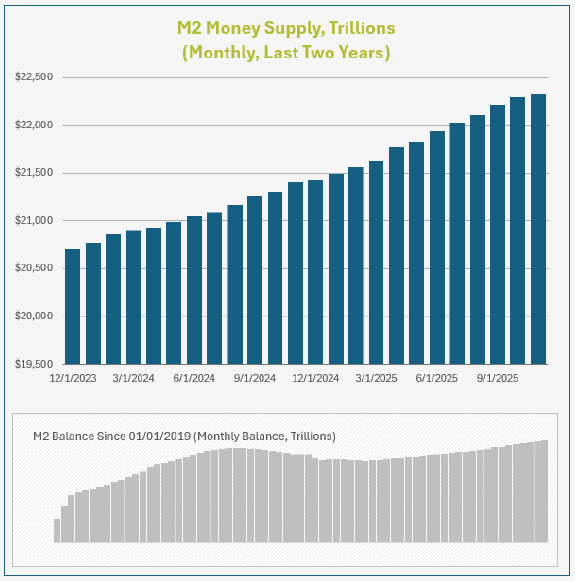
The M2 Money Supply, as tracked by the Federal Reserve, is a measurement of all cash, checking and savings deposits, and money market funds. Through various mechanisms, the Fed controls the amount of money in circulation. In a sentence, the theory is that money supply should grow at pace with GDP to maintain a cost equilibrium. During periods of an overheated economy, the supply should be contracted, while during a tough economy the supply of money should be expanded to provide liquidity.
Money supply surged at unprecedented rates following the Covid pandemic, and the explosion in liquidity was a contributor to the inflation that followed (a much larger pool of money was chasing the same volume of goods). The Fed then embarked on a campaign to tighten the money supply. This largely coincided with an economy in 2022 which nearly stalled out. Since 2024, the supply has resumed increasing at a more manageable rate.
An underappreciated aspect of Fed policy is that, in December of 2025, the Fed formally ended its multi-year program of Monetary Tightening. This is another positive indicator for the stock market.
Current policy doesn’t seem to be too tight for the economy to expand. It is possible that the Fed will have to contract money supply again if remaining inflation remains sticky and above target.
The Federal Reserve database measures Total Bank Credit (All Commercial Banks) as a dollar value of all loans and securities held by U.S. commercial banks. While bank lending can expand during a recession, it tends to do so at a much slower rate when banks are worried about getting a return on their investment. Tightening credit is one of the major hallmarks of an economic slowdown. Fortunately, we don’t see any weakness here. Over the last twelve months, extended bank credit has climbed from $18.1 trillion to $19.1 trillion. This roughly 5.5% increase is consistent with a mid-range economic expansion. For reference, Total Bank Credit contracted during the Great Recession, surged as high as 12% during the early 2,000’s boom-and-bust cycle, and tends to pace around 3-6% during periods of economic expansion.
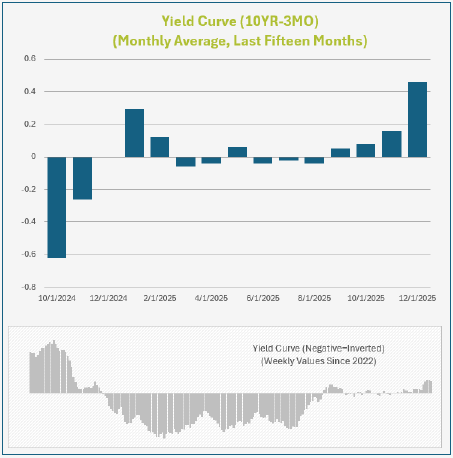
One of the most effective predictors of recessions (or, at least, of investor fear) is the inversion of short-term and long-term bond yields. While analysts use different ranges, we focus on the traditional yield-curve between three-month and ten-year treasuries.
By definition, short-term bonds pay smaller yields than long-term bonds. Investors expect a greater yield to tie their money up for longer periods of time. The concept is known as duration risk. When yields are said to “invert”, short-term rates are paying higher yields than long-term rates. A combination of increased demand for short-term yields and/or decreased demand for long yields pushes the rates into parity. A refusal of investors to invest their money for longer periods is indicative of a recession.
One of the handful of times in history where the yield curve inverted but a recession didn’t eventually result was in the 2022-2024 period. During 2025, the curve fluctuated between inverted and not dozens of times before finally trending toward normalcy at the end of 2025. The curve starts 2026 with the steepest un-inversion since 2022.
Our analysis of stock market fundamentals includes a framework for both long-term and short-term investment decision making.
Along with many other data points, to maintain a wide, macro concept of the investment market we monitor market-wide earnings ratios (focusing on the S&P 500 but studying many indices). We also monitor and search for trends incorporate stock performance as announced during quarterly earnings announcements.
We additionally maintain a proprietary short-term market momentum/volatility score to establish pockets of immediate caution or optimism.
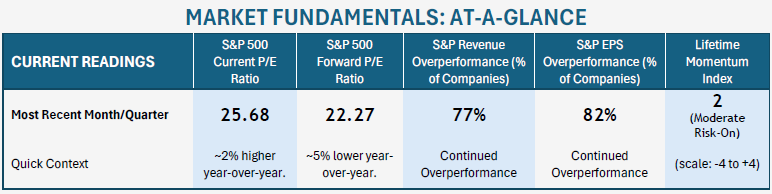
We maintain the Lifetime Momentum & Volatility Index (LMVI), a short-term investment and volatility framework which tracks four key datapoints across roughly a dozen screening formulas to arrive at a recommendation for immediate investing. On a scale of -4 (risk-off) to +4 (risk-on), our formulated benchmark finished the year with a score of +2 (“moderate risk-on”).
Over the course of 2025, the framework returned a positive score for much of the year, only identifying two periods of caution: from March until late-April, and a one-month period beginning in mid-October. Both periods denoted higher volatility and slower investment return.
Our other Market Fundamentals components look at longer-term market health.
As expressed to us by clients, perhaps the largest point of current investor concern is the idea that stocks are in a “bubble”. This is a natural outgrowth, first, following the third completed year of climbing stock indices. It is also to be expected given the increasingly popular narrative of such commentary. While it has become a national pastime to try to predict a bubble, it should be remembered that the vast majority of these predictions flop.
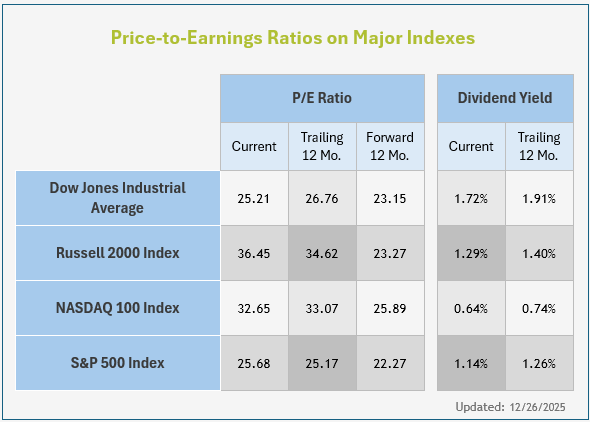
A Current P/E Ratio of the S&P 500 is calculated by dividing the price of every stock in the index by the earnings of every stock in the index. This is a necessary exercise to create a comparable ratio that can be used from period to period.
The current P/E ratio for the S&P 500 was 25.68 at the end of 2025. One year ago, the same metric was 25.17. Are stocks more expensive than they were a year ago? Yes, by about 2%. If it’s a bubble, it’s an ill-formed one.
While the “current” ratio is the one that (incorrectly) gets the most airtime on TV, stocks tend to be valued based on expectations of future earnings. You buy a stock today based not on its current profit, but what you expect those earnings will grow to. The Forward P/E Ratio of the S&P 500 divides the current stock price into projected future earnings. This metric of stock valuation has declined year-over year, where the current value is 22.27 and the same number one year prior was 23.44. Based on future earnings, stocks are approximately 5% cheaper than they were a year ago. Translation: stock values, while growing, are doing so slower than projected future earnings are.
A hallmark of a bull market is corporate profits which are climbing faster than analyst estimates. Similarly, a hallmark of a market peak is when companies begin to fail to outperform expectations (as projections of growth become ever loftier). This is why investors look so closely at quarterly stock announcements.
Most publicly traded stocks report performance on a quarterly calendar known as “earnings season”. Each company in the S&P 500 announces how well it did last quarter and, often, how it projects it will perform in the future.
During the third quarter, the average company massively overperformed expectations.
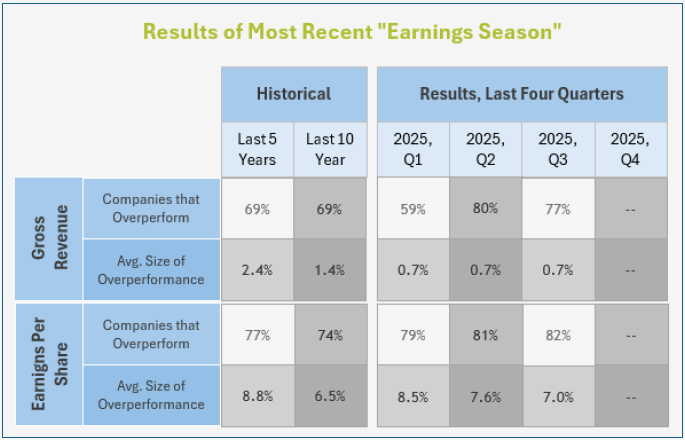
In the third quarter of 2025, 77% of companies beat Gross Revenue expectations by an average margin of 2.1%. This is far greater than performance at the beginning of the year and better than the historical averages of the last five or ten years. Where stock values climbed in 2025, these numbers explain it.
On the basis of Earnings-Per-Share (essentially a representation of net profit), stocks also continue to overperform. 82% of companies beat expectations by an overperformance margin of 7%.
While stock prices continue to climb, there are clear fundamental reasons for it. Ask yourself why stocks wouldn’t continue to rally against a constant stream of announcements and projections which reveal that the majority of them are making far more money than expected.
Some other relevant data parsed from Q3 earnings calls:
Looking ahead to early-2026 earnings, the S&P 500 is expected to continue delivering solid year-over-year profit growth. Current consensus estimates from FactSet call for approximately 12–13% EPS growth in Q1 2026, supported by mid-single-digit revenue growth and stable margins. Notably, earnings expectations have continued to trend higher in recent months.
On a full-year basis, analysts currently project S&P 500 earnings growth of roughly 14–15% for calendar year 2026, which would represent another year of above-trend profit expansion. Revenue growth expectations remain more modest (generally 6–7%), implying that incremental margin improvement continues to play an important role. While technology remains a key contributor, earnings growth is increasingly expected to broaden across sectors, reducing reliance on a narrow group of companies.
In short, near-term earnings expectations suggest that a majority of companies are positioned to meet or exceed current forecasts, reinforcing the view that recent market gains have been supported by fundamentals rather than valuation expansion alone. However, sector-level dispersion is likely to persist, with margin pressure more evident in industries sensitive to input costs, wage growth, and trade policy uncertainty.
Despite the narrative of stocks being “overvalued” or in a “bubble” we remain comfortable with the state of the U.S. economy and with prevailing stock valuations.
To be clear, we are not moving forward without concern:
Most other data points, along with most other underlying trends, are positive. The economy—especially the service sector—remains in “growth” mode. The U.S. consumer has continued to fuel the economy through 2025 without taking on any statistically meaningful additional debt.
Banks continue to lend at a rate indicative of economic expansion. Federal Reserve policy has greeted the economy with a series of interest rate cuts and the end of Quantitative Tightening.
Because corporate earnings are growing, stock valuations based on future earnings multiples have actually declined year-over-year.
Unless we see U.S. employment meaningfully crumble in 2026, we anticipate another solid year in the stock market. Even without stock valuation multiples continuing to expand, if earnings or net profit growth remain strong, stocks should climb by a pace at least equal to corporate profit expansion (high single digits to low double digits). Itis helpful to plan for more volatility than experienced in 2025, in part because that year carried uniquely low volatility. Additionally, mid-term election years have historically been more volatile.
Tying all data points together, we aren’t necessarily predicting “smooth sailing” or a straight line up in the market. However, we see little tangible evidence that stocks are ridiculously priced, that the economy is stalling out, or that the “good times” are in some other way coming to an end. We will encourage our clients to continue to invest, but to be resilient and cautious in 2026.
We maintain a series of allocation models for our clients and universally use the S&P 500 as a primary benchmark. The models are often allocated to mirror the composition of the S&P 500 while also adding some diversification into foreign stocks and small-cap companies.
Our models moved to a “risk-neutral” position following Liberation Day in 2025. Admittedly, in hindsight, it was an overreaction to abandon our “risk on” mode out of concerns over tariffs. We soon began to re-build risk positions, and by the end of the third quarter were back to taking moderately more risk than the S&P 500.
We quantify risk by comparing S&P exposure and areas we are underweight or overweight. More specifically, we over-allocate toward “growth” areas during times of economic expansion, focusing primarily on the fast-growing market sectors of Technology, Communications Services, and Financials.
For example purposes, we use our “Maximum Growth” allocation, which generally holds between 90% and 98% in stocks. The remainder is a small hedge of bonds or cash.
The allocation is even weight with the market in Materials, Financial Services, and Healthcare.
Correspondingly, we are slightly underweight in the value-leaning categories of Real Estate, Consumer Cyclical, Energy, Utilities, and Consumer Defensive.
Moving into the final quarter of the year, based on our renewed (and positive) outlook, we anticipate edging further into “growth” areas as appropriate, and in measured steps.
A few final summary notes for the quarter:

Our quarterly update. We discuss the market and economic developments of the past quarter, along with our updated market outlook.
Our monthly Market & Economic Framework provides an overview of the market and economy, along with a brief future outlook. Subscribe to receive a copy monthly in your inbox!

Our quarterly Market Outlook & Economic Forecast

At Lifetime Retirement Partners, we’re here to help you navigate your financial journey. Let’s create a personalized plan that aligns with your goals and adapts as your life evolves, providing you with confidence and peace of mind along the way.
Sign up for our newsletter and weekly mailings.
Osaic Form CRS
Check the background of your financial professional on FINRA's BrokerCheck.
The content is developed from sources believed to be providing accurate information. The information in this material is not intended as tax or legal advice. Please consult legal or tax professionals for specific information regarding your individual situation. The opinions expressed and material provided are for general information, and should not be considered a solicitation for the purchase or sale of any security.
We take protecting your data and privacy very seriously. As of January 1, 2020 the California Consumer Privacy Act (CCPA) suggests the following link as an extra measure to safeguard your data: Do not sell my personal information.
Securities and investment advisory services offered through Osaic Wealth, Inc. Member FINRA/SIPC. Osaic Wealth is separately owned and other entities and/or marketing names, products or services referenced here are independent of Osaic Wealth. This communication is strictly intended for individuals residing in the state(s) of AZ, CA, CO, FL, GA, IA, KS, MD, MO, NE, OK, SD, TN, TX, WA, WY. No offers may be made or accepted from any resident outside the specific states referenced.
This site is published for residents of the United States and is for informational purposes only and does not constitute an offer to sell or a solicitation of an offer to buy any security or product that may be referenced herein. Persons mentioned on this website may only offer services and transact business and/or respond to inquiries in states or jurisdictions in which they have been properly registered or are exempt from registration. Not all products and services referenced on this site are available in every state, jurisdiction or from every person listed. This website is not an offer to buy or a solicitation to sell securities.

