our office locations


Our monthly Market & Economic Framework provides an overview of the market and economy, along with a brief future outlook. Subscribe to receive a copy monthly in your inbox!
Drafted 05/01/2026
Published 05/05/2026
Download our April 2026 Market & Economic Framework as a PDF HERE
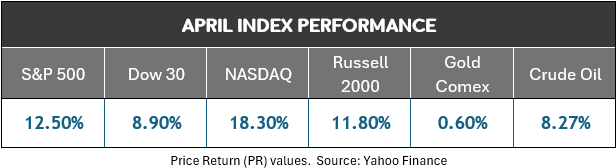
After a volatile start to the year, markets underwent a rapid transition in April from instability back to a more constructive footing. Following rotating sector weakness early in the year and additional pressure surrounding the onset of the Iran conflict, equities staged a broad recovery. The S&P 500 not only turned positive for the year during the month but returned to setting all-time high levels.
While the rebound in equities was initially sparked by a ceasefire in the Iran conflict, it was reinforced by a convergence of improving underlying conditions. On a price-to-earnings basis, stocks had hit their cheapest level in a year to begin April, even as corporate profit announcements were very strong. While inflation remains a persistent headwind, the broader set of economic and market indicators continues to reflect a generally stable and supportive environment.

Lifetime Retirement Partners maintains an index designed to measure short-term stock market momentum and volatility. The Lifetime Momentum & Volatility Index (LMVI) provides guidance on when to adopt a more conservative or aggressive posture within portfolios. The idea is not to “time the market”, but to identify periods of elevated risk or improving conditions.
The LMVI turned negative (risk-off) in February. Then, on April 3rd, toward the recent market bottom, it swung to a neutral value (an indicator to begin moving money back into the market). The current reading of +3 (on a scale of -4 to +4) reflects that volatility has declined and momentum has returned to the stock market. This encourages a fuller expression of risk within portfolios.
Download the most recent LMVI Report HERE (link always goes to most recent edition)

Lifetime Retirement Partners maintains an index which measures economic fragility. The Early Warning System is not intended to be a recession predictor, per say, but is calibrated to score eight market and economic indicators which tend to be leading indicators of weakness.
While the score ticked up slightly at the onset of the Iran conflict (and subsequent market sell-off), it finished April where it has sat for most of 2026: a “benign” score of 2.3 (out of 10). This indicates very little fragility in the economy. This isn’t predictive that investments will go up, but it does indicate a clear economic runway with a lack of fundamental stress.
Download the most recent LEWS Report HERE (link always goes to most recent edition)
Our proprietary economic database evaluates Macroeconomic Indicators across two separate categories: Real Consumer Demand and Economic Growth and Activity. The score remains positive, where it has resided for over a year, reflecting a stable economic backdrop.
REAL CONSUMER DEMAND: Inflation remains a key pressure point for both the economy and the consumer. The latest Personal Consumption Expenditures (PCE) inflation reading is modestly higher than a year ago. While price pressures have stabilized, the continued easing of inflation has stalled.
ECONOMIC GROWTH & ACTIVITY: GDP data turned in the second weak quarter in a row in April, partly influenced by tariffs and a government shutdown. However, broader measures such as Gross Output, along with continued expansion across services and manufacturing sectors, suggest that underlying economic activity remains intact. Additional production indicators, including truck tonnage shipped, have improved year-over-year, reinforcing the view of continued expansion.
LEARN MORE: OUR FULL & MOST RECENT MACROECONOMIC INDICATORS SLIDE DECK
Our proprietary economic database evaluates Monetary Indicators across two separate categories: Federal Policy & Lending & Liquidity. The score remains positive, where it has resided for over a year, reflecting a broadly supportive monetary backdrop.
FEDERAL POLICY: Policy remains accommodative, following several Federal Funds Rate cuts to end 2025. While rates remain elevated, they have come down 25% from recent highs. Money supply (M2) has expanded at a moderate pace over the past year, well below the surge seen during the pandemic and consistent with a stable growth environment.
LENDING & LIQUIDITY: Bank lending has steadily increased over the past year, supporting economic activity. While business loan delinquencies have moved slightly higher, they remain contained and do not currently signal meaningful stress in credit conditions.
LEARN MORE: OUR FULL & MOST RECENT MONETARY INDICATORS SLIDE DECK
Our proprietary economic database evaluates consumer strength across two primary areas: Employment and Consumer Health. The current overall score is +1 (neutral), reflecting a stabilization from earlier weakness (the score was negative to start the year).
EMPLOYMENT: The improvement in our overall grade relates to stabilizing employment conditions, which have improved modestly. Initial jobless claims remain low, and after a gradual rise through 2025, most key unemployment measures have shown improvement. The labor market continues to reflect a “low hire, low fire” environment.
CONSUMER HEALTH: While concerns around a stretched consumer persist, the data remains more balanced than media narrative suggests. Household debt has increased year-over-year but at a moderate historical pace. Consumer delinquency rates have edged higher from recent lows but remain near longer-term averages. At the same time, real wages have outpaced inflation for eleven consecutive quarters, providing continued support for consumption.
LEARN MORE: OUR FULL & MOST RECENT CONSUMER STRENGTH SLIDE DECK
While our framework does not assign a formal score to stock market fundamentals, the current assessment remains positive, reflecting a broadly supportive backdrop for equities.
Following a meaningful pullback in March, markets staged a historically strong rebound in April. Valuations moved higher as the S&P 500 price-to-earnings ratio increased from 23.55 to 25.41 (using end-of-week values). However, based on forward earnings expectations, valuations remain below levels seen for much of the past two years, suggesting that recent gains have been supported, in part, by improving earnings expectations.
Corporate earnings season began in April, and results to date have been broadly positive, reinforcing the underlying strength of the market.
LEARN MORE: OUR FULL & MOST RECENT MARKET FUNDAMENTALS SLIDE DECK
While April’s rebound was rapid, it was not without foundation. Improving momentum, stabilizing economic conditions, and broadly supportive earnings results have combined to create a more constructive backdrop for equities. At the same time, key risks remain. These include persistent inflation pressures and the potential for renewed volatility following such a sharp recovery, along with the likelihood of another “flare up” in the Iran conflict. As a result, the current environment supports participation in the market, but with an awareness that conditions can shift quickly.
Contact us or ask questions! tony@lifetimeretirementpartners.com

Our quarterly Market Outlook & Economic Forecast

Clients often wonder how the market can "just keep going up". One of the answers is the "creative destruction" which the market is constantly undergoing.

We conduct extensive research over dozens of data points to provide an economic and market outlook. Lifetime Retirement Partners works hard to analyze investment conditions and help set expectatons for our clients.

At Lifetime Retirement Partners, we’re here to help you navigate your financial journey. Let’s create a personalized plan that aligns with your goals and adapts as your life evolves, providing you with confidence and peace of mind along the way.
Sign up for our newsletter and weekly mailings.
Osaic Form CRS
Check the background of your financial professional on FINRA's BrokerCheck.
The content is developed from sources believed to be providing accurate information. The information in this material is not intended as tax or legal advice. Please consult legal or tax professionals for specific information regarding your individual situation. The opinions expressed and material provided are for general information, and should not be considered a solicitation for the purchase or sale of any security.
We take protecting your data and privacy very seriously. As of January 1, 2020 the California Consumer Privacy Act (CCPA) suggests the following link as an extra measure to safeguard your data: Do not sell my personal information.
Securities and investment advisory services offered through Osaic Wealth, Inc. Member FINRA/SIPC. Osaic Wealth is separately owned and other entities and/or marketing names, products or services referenced here are independent of Osaic Wealth. This communication is strictly intended for individuals residing in the state(s) of AZ, CA, CO, FL, GA, IA, KS, MD, MO, NE, OK, SD, TN, TX, WA, WY. No offers may be made or accepted from any resident outside the specific states referenced.
This site is published for residents of the United States and is for informational purposes only and does not constitute an offer to sell or a solicitation of an offer to buy any security or product that may be referenced herein. Persons mentioned on this website may only offer services and transact business and/or respond to inquiries in states or jurisdictions in which they have been properly registered or are exempt from registration. Not all products and services referenced on this site are available in every state, jurisdiction or from every person listed. This website is not an offer to buy or a solicitation to sell securities.

