our office locations


Our quarterly Market Outlook & Economic Forecast

Drafted 03/31/2026
Published 04/03/2026
NOTES:
Download this report as a PDF HERE
Download a current PDF version of our Lifetime Early Warning System (LEWS) HERE
Download a current PDF version of our Lifetime Momentum & Volatility Index (LMVI) HERE
The economy remains in a period of economic expansion. A worthwhile question isn’t whether this is the case, but how far we are through an economic growth cycle. With many of the data points which we track indicating a positive environment, we have come to believe that we are in neither the early nor later stages of an expansionary cycle.
There is always some weakness in the data. Economic indicators are almost never all positive or all negative, and the larger the pool of data the more likely some divergence becomes. Economists and Investment Managers are primarily looking for degrees of concern; in what direction, and by how much, does the data lean?
Current economic characteristics which suggest a healthy, “mid-stage” bull market:
Economists look closely for signs of an economic peak, which are largely the inverse of the prior bullet points. To name a few:
After a strong market run through the summer of 2025, the later part of the year saw increased volatility. In December, growth stocks started to lose their leadership. In late-2025 and early-2026, the market didn’t pull back but did start to stall out and repeatedly struggled to return to previous highs.
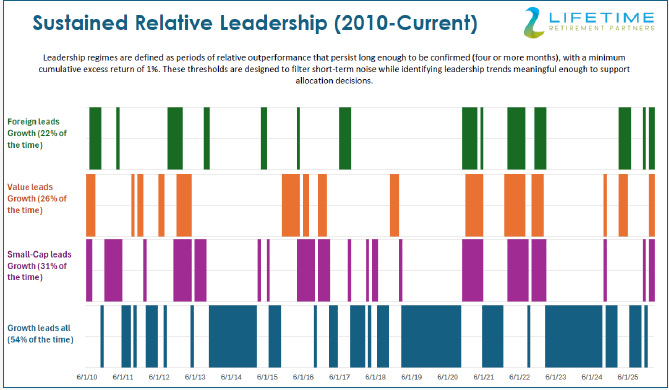
The first portion of 2026 was defined by a very traditional sector rotation in the market. Money was flowing out of growth equities and into three other areas: foreign stocks, value stocks, and small-cap companies. All three categories rallied to start the year while growth pulled back.
Growth stocks tend to lead the market by default as their higher compounding power attracts investors. In a study that we assembled, growth was the confirmed market leader more than 50% of the time. Foreign, value, and/or small-cap stocks would demonstrate brief, occasional leadership before money eventually returns to growth.
This can occur due to market dynamics, such as investors fleeing from growth stocks during market or economic fears. Value stocks, for example, often “lead” growth by declining less during sharp market pullbacks. Growth can also lose its leadership for short intervals simply to take a breather after it has run too far, too fast. It sells down a little, and then the cycle begins again.
The start of 2026 year looked like a textbook case of a “traditional rotation”. Value, foreign, and small-cap stocks all outperformed the S&P 500 in the first two months of the year. Growth was consolidating (especially in the software sector) but, with no material economic or market declines to spur the pullback, it looked certain to reassert its leadership at some point. A straightforward, likely temporary, sector rotation.
Then came Iran.
On Friday, February 28th, American and Israeli combined forces began to strike Iran from the sky. The Iranian air force and navy were quickly decimated, and their missile launching capabilities gradually eroded.
As an investment firm, we take no stance on the necessity, merit, or execution of such a campaign. We express only what is necessary from an economic standpoint, exploring the immediate investment and long-term economic impact.
The launch of hostilities with Iran created a sudden shock to the investment market—every investment market. It ushered in a “no quarter” environment where everything was suddenly in decline. Not only were stocks pulling back, so were bonds and gold. The chain reaction in investor worries rippling through the market follows a logical speculative sequence:
Rate hikes are bad for both stocks and existing bonds, and ever yasset was quickly repriced when confronted with war. Almost every major investment area declined.
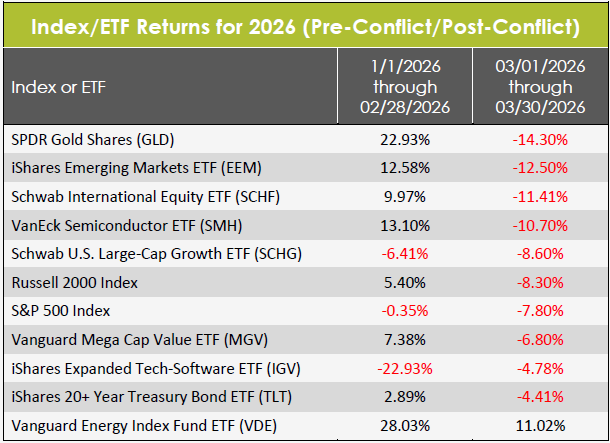
Note the non-growth performance in emerging markets, developed foreign, large-value, and small-cap (Russell 2000) investments prior to the war, along with rallies in gold and bonds. The same areas were among the biggest losers once the conflict started.
To understand the status of the confrontation from a market perspective, start with what seems to be an absolute truism: the longer the conflict drags on, the bigger the impact on the economy becomes. Investments at this point revolve around the timeline.
At the onset of hostilities, the earliest public comments from President Trump established an expected timetable of “four to five weeks” to the New York Times ( a timeline reiterated the next day in a Fox News interview). It was similarly established as “four-to-six weeks” by spokesperson Karoline Leavitt.
Market anxiety increased during the course of the last month, possibly because what felt like exponential progress in the early days seemed to begin grinding slower. At the end of March, we’ve now started to enter that “four-to-six week” window with an unclear prospect for the end of hostilities. Note that the stock market rallied strongly on the last day of the quarter as simultaneous reports started to emerge that Iran’s President Pezeshkian was open to ending the conflict while President Trump claimed that Iran had accepted most of its conditions to an end of hostilities.
One possibility is that all of these reports are correct and that the conflict will soon be resolved. If so, it’s easy to imagine that it’s possible to return to the world of a month ago, though Iran may have lost some of its ability to effectively rattle sabers in the intermediate. Depending on the terms of a near-term surrender, oil and asset prices could reset quickly, and any inflation impact could be minimal.
That scenario would be positive for the market, though it would be hard to say if the Administration would have achieved all of its goals: the IRGC and existing theocracy would remain in power (at least for now) and, presumably, still be in de facto control of the Strait of Hormuz.
Prior to the developments on the last day of the quarter, betting odds had been climbing sharply that the U.S. would have “boots on the ground” in the coming weeks. If this came to pass, it could still be short-term in nature, just enough to fully dislodge Iranian strength around Kharg Island and the Strait of Hormuz. It was also reported that the U.S. was considering a mission where troops would recover Iran’s enriched uranium.
Given the available data, our take is that the Trump Administration clearly does not want to be involved in a long-term conflict but may also have some remaining objectives. The conflict may be over in days but, if it isn’t, it is unlikely to drag for months. The potential exists for the Admin to de-escalate on something that resembles its original timetable.
Before the conflict with Iran was launched, something else was making the market nervous: artificial intelligence. AI-related concerns were the lead market driver for most of January and February, with seemingly any announcement from AI business Anthropic sending relevant market sectors into freefall.
Particularly hard hit was the category of business software once Anthropic released a coding tool. The stocks of corporate software companies such as Intuit and Workday, along with cybersecurity names such as Crowdstrike, began to spiral downward on the new idea that such software-driven firms could easily be replaced in the future. The iShares Expanded Tech & Software ETF dropped over 25% in the first quarter.
More broadly, the market is looking for AI-fueled layoffs as the technology picks up abilities and potentially disrupts labor markets.
There is no question that AI will lead to some job disruption: every major technology evolution does. However, we believe that there is a common thread in AI and the conflict in Iran. What the market has looked past so far in 2026 is the potential that these chaos agents will be long term positives for the market and economy.
While Artificial Intelligence is likely to lead to job displacement, there is no evidence that it will lead to net job displacement, destroying more jobs than it can help to create. The dislocation may be real; the cuts could come before the creation. But to think that jobs will disappear in a vacuum, with nothing else to ever emerge, is the type of economic thinking which has been oft predicted in history but never realized.
Similarly, while the market angst is understandable, there is a very real possibility that a defanged Iran could lead to a more stable Middle East. Once the original disruption has passed, it’s not unfathomable that oil eventually ends up at even cheaper levels than it was at in the first place. It’s easy to see it as a pill which had to be swallowed.
We encourage our clients to remain calm in the face of these disruptions. As we will begin to discuss shortly, the American economy remains strong. Before we move into our economic outlook, there is one additional disruptor which should be reviewed: tariffs.
Lost in the shadow of AI-driven valuation fears and the burgeoning conflict with Iran, the biggest economic story of 2025-- the Administration’s tariff agenda-- has been shuffled to the back pages.
As we projected multiple times over the last year, on February 20th, 2026, the Supreme Court struck down the Trump Admin’s use of tariffs through the Emergency Powers of the IEEPA. That was not the end of the story. It is, as they say, the end of the beginning. Here, in brief, we cover only the expected aftermath and likely next developments.
After the Supreme Court ruling, the admin immediately put in place a 15% blanket tariff on all imports for 150 days (the maximum duration permitted under Section 122 of the Trade Act of 1974). During this nearly halfyear window, the Administration is expected to transition toward more durable tariff measures. This includes expanding industry-specific tariffs under Section 232 and initiating country-specific actions under Section 301, along with related authorities such as Sections 201 and 331.
This isn’t the venue in which to go into detail but to impart our overall view. The Trump Administration will find itself under somewhat firmer legal footing with these rounds of tariffs, but this legal backstop is not absolute. For example, if they claim multiple injuries across many sectors and toward many countries, and if the review procedures involved (required agency investigations and formal findings) are perceived as being little more than a rubber stamp for “all things tariff”, it becomes more vulnerable to legal scrutiny. Using statutes designed for targeted tariffs to implement broad, multi-sector trade restrictions is likely to invite renewed legal challenges under the “Major Questions” doctrine and nondelegation principles. The broader and more generally the Administration applies these tools, the more vulnerable they are to judicial scrutiny.
While tariffs have been replaced by other headlines, they remain an unresolved risk and are likely to re-emerge in 2026 as a major economic issue.
We created and maintain two separate indices which measure different dimensions of economic strength.
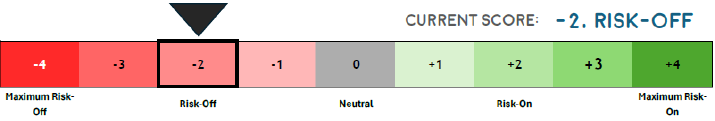
The Lifetime Momentum & Volatility Index (LMVI) is a short-term investment and volatility framework which tracks four key datapoints across roughly a dozen screening formulas. The index is designed to filter the key component, volatility, and, when present, clarify whether it is structural or transitory. It is calibrated to be minimally responsive and should only trigger an “alarm” a few times during a normal year. It reports on a scale of -4 (risk-off) to +4 (risk-on).
After reading positively for much of the last year, the index has recently pulled down to a “risk-off” stance. The shift began in early February when stock valuation fears related to Artificial Intelligence disruptions were rattling the market. The involvement in Iran accelerated the decline. Out of the four components in the index, two are market/momentum based while the other two relate more to credit and economic strength. It is the two market components which have pulled the LMVI lower, while financial stress has not shown in the system. As the decline is not yet systemic, the market remains in a positive position if the Iran situation was resolved quickly.
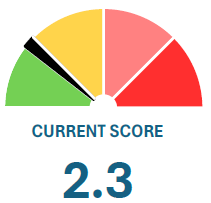
The Lifetime Early Warning System (LEWS) is a similar tool with a completely different goal. Instead of being calibrated around short-term volatility it is intended to diagnose economic fragility. Its eight components are forward-looking economic and market indicators. These include yield curve inversions, initial jobless claims, bond spreads, defensive market rotations, and bank lending. Unlike our volatility index, LEWS is attuned to be highly sensitive and rise at the first sign of stress.
On a 0-10 scale, the indicator currently has a very low score of 2.3 (categorized as “Benign”).
While the stock market, at the initiation of the Iran conflict, has given us the biggest shock in a year, we see virtually no fragility developing in the economy as a result. While the longer the Iran conflict goes the more likely it is to create said fragility, none is present in the economy at this time.
Our study of consumer strength tracks nearly a dozen data points and splits cleanly into two sub-indices: Labor Market Strength & Consumer Health.
Labor Market Strength includes key indicators such as unemployment data, job openings, (voluntary) job quitting, payroll growth, and jobless claims.
Consumer Health reflects the balance-sheet strength of households. Factors include debt levels, delinquency trends, and the purchasing power of wages.
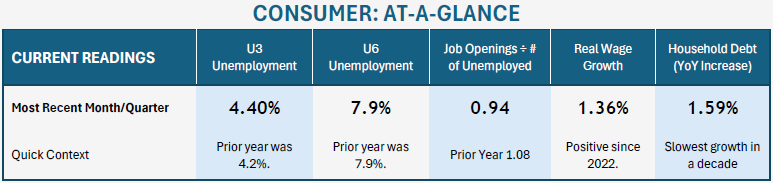
At the peak of the Covid era, unemployment massively surged but then—almost as quickly—tracked to some of the lowest figures in history. Since 2023, lead unemployment figures have slowly ticked higher (from historical lows). Presently, the labor market is defined by both low hiring and low job loss.
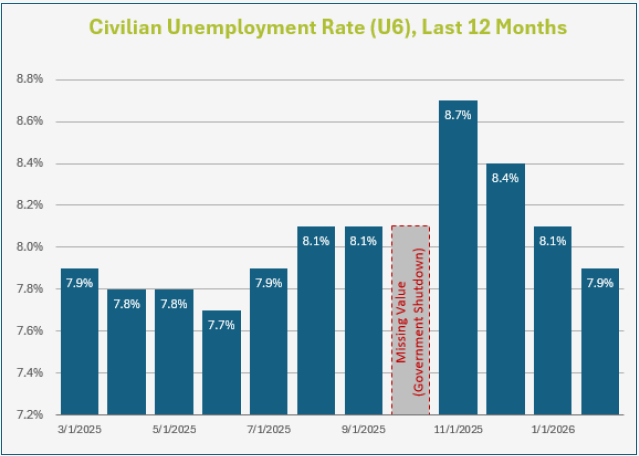
When tracking the labor market, our favorite indicator is the U6 Unemployment Rate which, after spiking last November to the highest level since 2021, has staged a sudden reversal with consecutive declines in each of the last four months. The value is now unchanged from where it was one year ago: 7.9%. It is now only marginally ahead of the simple average for the last five years (7.63%).
Another key labor indicator which economists track as forward-looking/ predictive are Initial Jobless Claims. They measure the number of individuals filing for unemployment benefits for the first time, providing a timely indicator of labor market conditions. Despite some expectations to the contrary in economic circles, jobless claims have declined marginally from one year ago.
We don’t fully discount the popular current narrative of a “K-shaped economy”; sticky inflation certainly effects those at the bottom income percentiles the hardest. However, we do think that the narrative of a “stretched consumer” has been oversold.
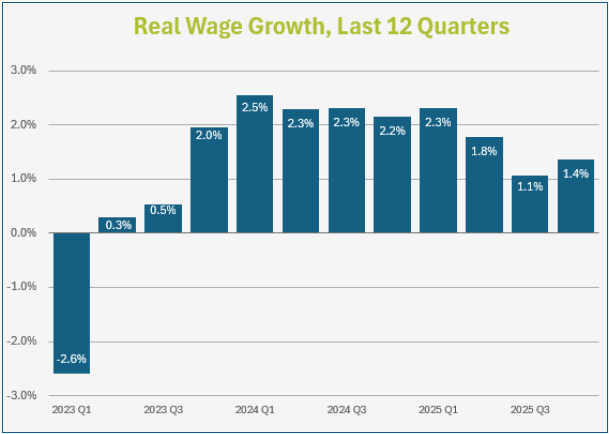
Real Wage Growth faltered during “peak inflation”, running negative for about two years. Since then, even with continued persistent inflation, wages have now grown faster than inflation for eleven straight quarters.
Total Consumer Credit Outstanding, a measurement of all consumer indebtedness (including mortgages, credit cards, student loans, etc.), has climbed by only 1.59% over the last year. This is slower than the rate of a year ago, much slower than the five-year average of 4.8%, and demonstrates outstanding debt as climbing at about the same rate as Real Wage Growth. For context, it is normal for Consumer Credit to climb over time. It is only alarming when growing at an elevated or accelerating rate. Credit Card Delinquency Rates are also fractionally lower than one year ago (2.94% vs. 3.08%).
A modern economy is built on consumer spending and key indicators show that, while consumer spending is strong, the average citizen is currently not taking on meaningful additional debt to be able to spend.
We track a number of macroeconomic indicators which can generally be broken down into two categories: Economic Growth and Inflation. The factors continue to depict an economy which is strong but shows some signs of slowing around the edges, coupled with sticky inflation which began to reassert itself in late-2024.
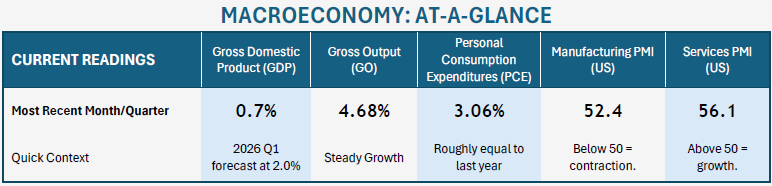
While inflation remains an issue for the American economy, almost all of the other macroeconomic indicators which we track indicate a stable trajectory of growth. This is true with broad economic estimates (GDP or Gross Output), sector estimates (manufacturing or services) and shipment data (such as Truck Tonnage Shipped or Industrial Production measurements). All report strength.
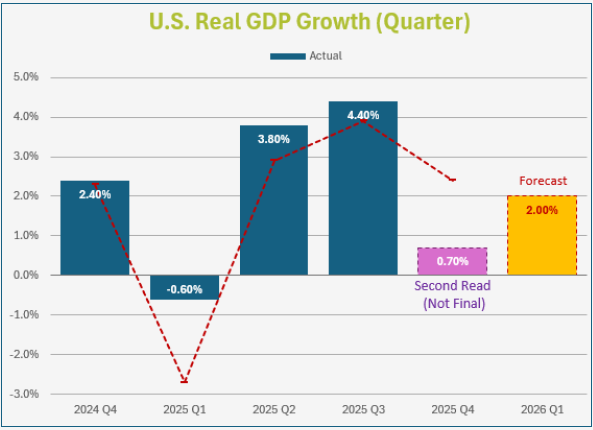
The Federal Reserve Bank of Atlanta publishes the GDPNow forecast which estimates Gross Domestic Product (GDP) growth in real time as each quarter progresses. Where they projected that the fourth quarter of 2025 was coming in at 2.4% annualized growth, the actual read for that quarter was an underwhelming 0.7%.
The anemic final value reflects a combination of temporary disruptions rather than a clear deterioration in and weighed on net exports, while the partial government shutdown further dampened activity through reduced federal spending and administrative delays. Together, these factors created a meaningful drag on headline growth, masking what appears to be a more stable underlying economic trend heading into 2026.
As the first quarter of 2026 draws to a close, the current GDPNow projection for growth reads 2.0%. This compares to last year’s year-over-year increase of 2.4% and indicates moderate growth in the economy.
The current estimate for full-year 2025 U.S. GDP growth is approximately 1.8%, based on available data. While slightly below the roughly 2% pace of recent years. Looking ahead, consensus expectations for 2026 call for growth in the 1.8–2.0% range, suggesting a continuation of a modest but stable expansion.
While GDP remains a widely followed measure, we prefer Gross Output (GO) as a broader gauge of economic activity. Similar in concept to GDP, it captures total sales across all industries, including both final goods and services and intermediate inputs.
The most recent Gross Output data shows year-over-year growth of 4.68%, with readings consistently ranging between 4.2% and 4.8% over the past six expansion than the more volatile GDP figures.
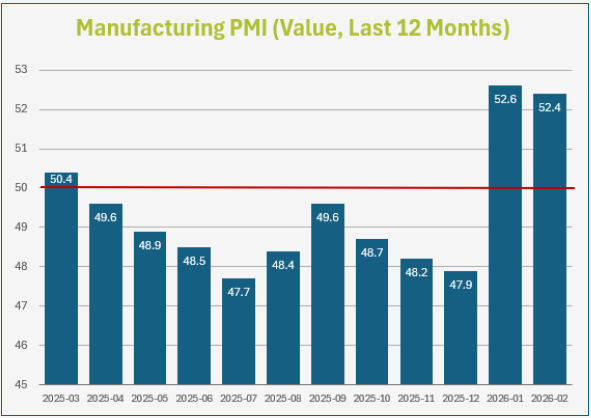
The Purchasing Managers’ Index (PMI), compiled by the Institute for Supply Management (ISM), conducts surveys with purchasing managers regarding orders, production, and employment. They are a leading indicator of economic health. We track both the Manufacturing and Service sectors. In this data, 50 is the watermark value. Under 50 indicates a contraction, while values over 50 indicate expansion.
The Services indicator includes categories such as Finance, Healthcare, and Retail, and makes up over 70% of the economy. Recent readings have been predominately positive (only one negative month in the last two years) and the current level of 56.1 indicates strong (and accelerating) growth. Last month’s value was the strongest since 2023. ISM’s semiannual forecast projects continued expansion in 2026.
Manufacturing PMI figures, which spent most of 2025 (and prior) in a contraction, have shown a sudden rebound to start the new year. While a return to expansion was expected at some point (ISM’s Fall 2025 Semiannual Forecast said manufacturing supply managers expect overall growth in 2026 and are “more excited about faster growth in the second half”) it was surprising to have the rebound suddenly upon us. Prior to the last two months (52.6 in January, 52.4 in February), only two of the prior forty-eight months had been positive.
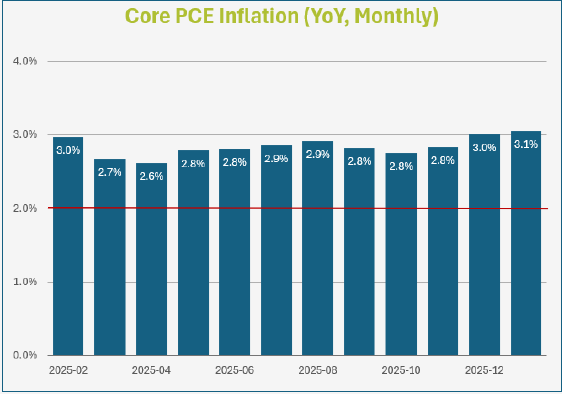
Core Personal Consumption Expenditures (PCE) inflation reported most recently in January at an annualized growth rate of 3.06%. In addition to remaining 50% higher than the Fed’s 2% target, it was the highest reading since early 2024. While economists expect inflation to resume a trajectory of decline in 2026, this “sticky” inflation is perhaps the biggest current problem with the American economy (and the biggest part of why consumer sentiment remains deeply negative).
Unless the labor market softens, or unless PCE inflation numbers see material moderation in 2026, the Fed is unlikely to move into another round of interest rate cuts.
To monitor the monetary condition of the United States economy—often analogized as the oil of an economic engine—we track roughly one dozen data points which can be broken into two broad categories: Federal Monetary Policy and Lending and Liquidity.
Federal Monetary Policy focuses primary on the movements of the Federal Reserve: both in its manipulation of the Federal Funds rate and the movements of the federal balance sheet. The Federal Reserve helps to set the table of economic conditions.
Bank Lending & Liquidity is one of the great early indicators of expansions and contractions. Almost every recession is presupposed by banks tightening their lending standards and volume. Banks go through cycles where they fear they are “missing out” by not lending more, eventually pivoting to times where they are restrictive and fear they won’t get their money back.
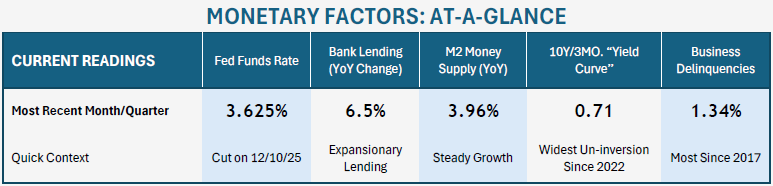
Progressing through 2026, monetary indicators point toward a stable-to-improving picture for the American economy. Interest rates have recently dropped (which is stimulating for stocks), and, while still narrow, the yield curve is at its widest un-inversion in nearly three years. Bank lending remains unrestricted and money supply growth has normalized.
One of the primary components in how stocks are valued is the overall interest rate environment. Historically, one of the greatest catalysts for stock value increases is a reduction in the Effective Federal Funds Rate. The logic is straightforward: as rates drop on instruments like CDs, there is less competition for stocks. Also, lower rates directly impact the bottom line of stocks: the lower the cost of debt servicing, the greater the profit. Conversely, as rates climb, higher non-stock yields act as competition.
The Federal Reserve hiked rates multiple times in 2022 and 2023 in an effort to combat inflation, ultimately bringing federal lending rates to the highest level since before the Great Recession. As inflation slowed, the Fed cut rates by one full point in 2024. Rates moved from a target of 5.33% down to 4.33%. After a long pause, rate cuts resumed in 2025, reducing rates another three-quarters of a point to a current mid-range value of 3.625%. While this is still the highest rate in more than a decade, it represents a roughly 25% overall reduction in just over one year.
Where interest rate cuts are favorable for stocks, so are projections for additional rate cuts. At the end of 2025, per the CME Group FedWatch predictor tool, the market expected an 83% chance of at is zero additional rate cuts in 2026 (77% odds of no rate changes through December). Chances of a rate hike have increased but are still very minimal.
We wrote last quarter that “projections for multiple rate cuts [for 2026] are premature”. Today, we don’t believe that the numbers of the moment predicting zero rate cuts are meaningful (though it does move the market closer to our base case). Current rate expectations are clouded by the “fog of war”. These numbers are certain to be reset in the next thirty-to-sixty days, so it isn’t a worthwhile endeavor to parse through them further. We would say simply for now that the friction in the Fed’s “dual mandate”, which tasks it with both full employment and a stable currency, is more likely to lean toward sticky inflation than it is toward attending to the labor market. At a minimum, cuts in the next few months are extremely unlikely.
The M2 Money Supply has grown at a stable, normal rate of 3.96% over the last year. This is similar to the prior year, but much lower than the ten-year average of 5.82% which included both a period of post-Covid inflationary spending and subsequent money supply tightening.
The current rate of growth is normal. As a base concept this value should grow over time at a rate roughly keeping pace with GDP and wage growth to keep the economy in equilibrium.
An underappreciated aspect of Fed policy is that, in December of 2025, the Fed formally ended its multi-year program of Monetary Tightening. This is another positive indicator for the stock market.
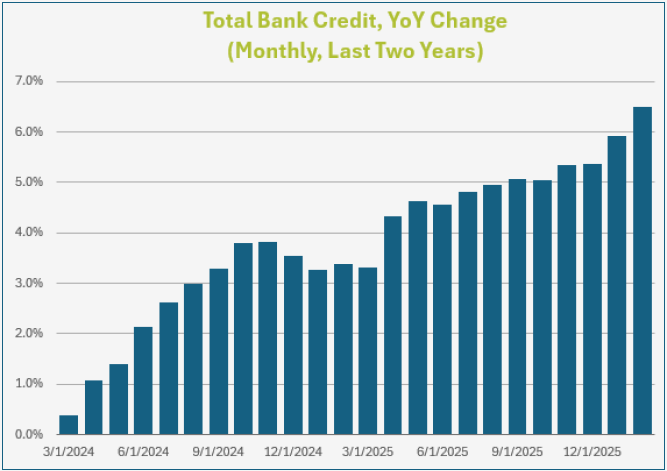
The Federal Reserve database measures Total Bank Credit (All Commercial Banks) as a dollar value of all loans and securities held by U.S. commercial banks. While bank lending can expand during a recession, ittends to do so at a much slower rate when banks are worried about getting a return on their investment. Tightening credit is one of the major hallmarks of an economic slowdown. Fortunately, we don’t see any weakness here. Over the last twelve months, extended bank credit has climbed from $18.2 trillion to $19.26 trillion. This roughly 6.5% increase is consistent with economic expansion. For reference, Total Bank Credit contracted during the Great Recession, surged as high as 12% during the early 2000’s boom-and-bust cycle, and tends to pace around 3-6% during periods of economic expansion.
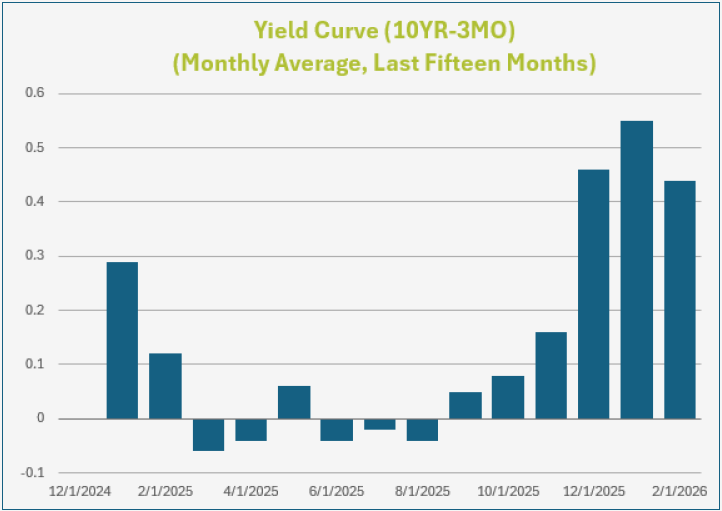
One of the most effective predictors of recessions (or, at least, of investor fear) is the inversion of short-term and long-term bond yields. While analysts use different ranges, we focus on the traditional yield-curve between three-month and ten-year treasuries.
One of the handful times in history where the yield curve inverted but a recession didn’t eventually result was in the 2022-2024 period. During 2025, the curve fluctuated between inverted and not dozens of times before finally trending toward normalcy at the end of 2025. Presently, at the end of the first quarter of 2026, the yield curve is at the steepest un-inversion since 2022. The recent strengthening, which may sound a little counterintuitive, has been fueled by Iran-related stress on the long end of the curve.
Our analysis of stock market fundamentals includes a framework for both long-term and short-term investment decision making.
Along with many other data points, to maintain a wide, macro concept of the investment market we monitor market-wide earnings ratios (focusing on the S&P 500 but studying many indices). We also monitor and search for trends in corporate stock performance as announced during quarterly earnings announcements.
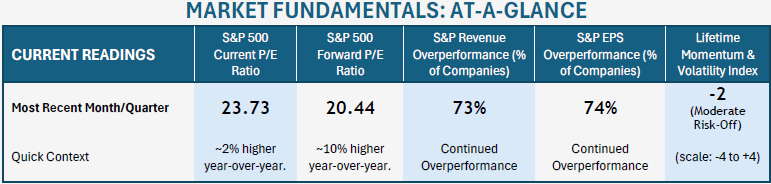
Compared to values one year ago, current price-to-earnings ratios show stocks to be slightly more expensive by about 2%. However, that comparison is a strange one because both 2025 and 2026 began the year with significant market pullbacks. That stocks are slightly more expensive than during last year’s market selloff isn’t particularly edifying.
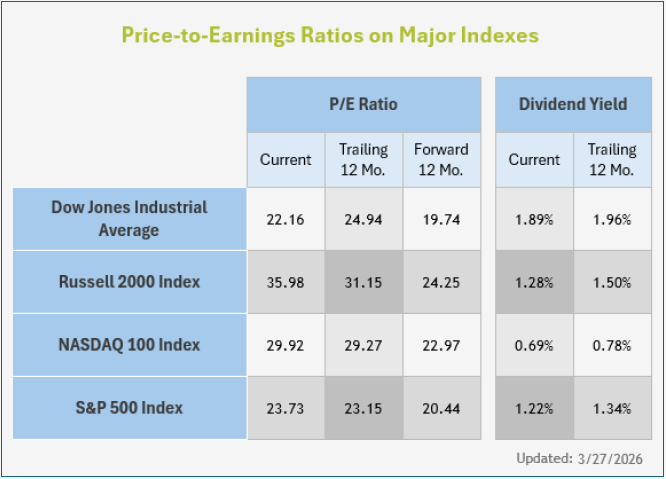
This time last year, right before Liberation Day, the market had a current P/E ratio of 23.15. This week (ending March 27th) the S&P 500 had a composite ratio of 23.73.
Both levels represent a pullback from recent highs: On 12/01/2025 the same measurement was 31.02. On 12/01/2024 the same level was 28.6. Both represented massive declines from lofty stock valuations. A more relevant way to look at it is that the current ratio is the lowest it has been since 2023 (right before a significant rally started which began to push P/E ratios higher). Stocks are currently among the cheapest levels of the last three years.
While the “current” ratio is the one that (incorrectly) gets the most airtime on TV, stocks tend to be valued based on expectations of future earnings. You buy a stock today based not on its current profit, but what you expect those earnings will grow to. The current Forward P/E Ratio of the S&P 500 of 20.44 is also the second cheapest level since 2023 (again, just behind Liberation Day). On a forward basis, stocks are roughly 10% cheaper than the average value of the last two years.
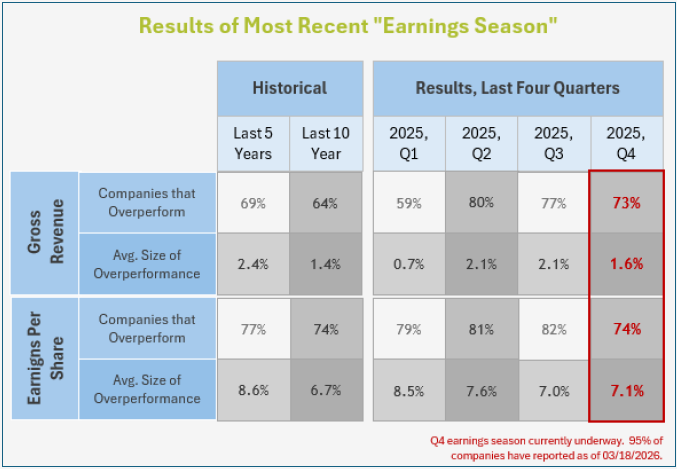
A hallmark of a bull market is corporate profits which are climbing faster than analyst estimates. Similarly, a hallmark of a market peak is when companies begin to fail to outperform expectations (as projections of growth become ever loftier). This is why investors look so closely at quarterly stock announcements.
While the current Earnings Season (announcements for the fourth quarter of 2025) hasn’t completely finished as the data was compiled, over 95% of companies have reported.
During the fourth quarter, the average company overperformed expectations by a strong margin. 73% of companies overperformed revenue expectations and 74% beat net earnings expectations. Investors two quarters. A slightly slowing quarter set off some fears of deceleration, a sign of an economic peak. This has contributed to a quarter in which profits and earnings rose, but stock market indexes declined.
However, analysts continue to expect strong upside for 2026, with revenue maintaining steady growing in the mid-single digits and earning accelerating to 14-15% growth. Remember that in the long-term, this is what drives equity values.
CONCLUSIONARY FORECAST
While the stock market has been off to a difficult beginning in 2026, we are optimistic about potential equity performance in coming months.
While naturally dominating the headlines of the day, we find it unlikely that the Iran situation is a conflict which will drag on for months or years. In fact, one possible scenario is that it comes to some form of resolution in the next few weeks (in our economic view, a “resolution” is defined by a reopening of the Strait of Hormuz and a secession of hostilities). Such a development could still come on the original timeline announced. If so, this could even line up with a new earnings season starting in April which we expect to be strongly positive. Assuming it isn’t a letdown, the market could have some real catalysts right in front of it.
To get that far requires speculation. Circle back to what we know:
While the future isn’t guaranteed, the backdrop has become positive for the economy and stock market. We are at a place of healthy optimism, despite the difficult road of the last few months.
Our monthly Market & Economic Framework provides an overview of the market and economy, along with a brief future outlook. Subscribe to receive a copy monthly in your inbox!

Clients often wonder how the market can "just keep going up". One of the answers is the "creative destruction" which the market is constantly undergoing.

We conduct extensive research over dozens of data points to provide an economic and market outlook. Lifetime Retirement Partners works hard to analyze investment conditions and help set expectatons for our clients.

At Lifetime Retirement Partners, we’re here to help you navigate your financial journey. Let’s create a personalized plan that aligns with your goals and adapts as your life evolves, providing you with confidence and peace of mind along the way.
Sign up for our newsletter and weekly mailings.
Osaic Form CRS
Check the background of your financial professional on FINRA's BrokerCheck.
The content is developed from sources believed to be providing accurate information. The information in this material is not intended as tax or legal advice. Please consult legal or tax professionals for specific information regarding your individual situation. The opinions expressed and material provided are for general information, and should not be considered a solicitation for the purchase or sale of any security.
We take protecting your data and privacy very seriously. As of January 1, 2020 the California Consumer Privacy Act (CCPA) suggests the following link as an extra measure to safeguard your data: Do not sell my personal information.
Securities and investment advisory services offered through Osaic Wealth, Inc. Member FINRA/SIPC. Osaic Wealth is separately owned and other entities and/or marketing names, products or services referenced here are independent of Osaic Wealth. This communication is strictly intended for individuals residing in the state(s) of AZ, CA, CO, FL, GA, IA, KS, MD, MO, NE, OK, SD, TN, TX, WA, WY. No offers may be made or accepted from any resident outside the specific states referenced.
This site is published for residents of the United States and is for informational purposes only and does not constitute an offer to sell or a solicitation of an offer to buy any security or product that may be referenced herein. Persons mentioned on this website may only offer services and transact business and/or respond to inquiries in states or jurisdictions in which they have been properly registered or are exempt from registration. Not all products and services referenced on this site are available in every state, jurisdiction or from every person listed. This website is not an offer to buy or a solicitation to sell securities.

