Drafted 07/02/2026
Published 07/08/2026
Download the PDF version of our report HERE.
EXECUTIVE SUMMARY
- • After a market sell-off in Q1 of 2026, stocks staged a dramatic turnaround in the second quarter. All major indices are now up for the year.
- • Much of the recent rally has been supported by exceptionally strong first-quarter earnings, with analysts continuing to project healthy profit growth through the remainder of 2026.
- • On a forward earnings basis, stock valuations remain slightly cheaper than one year ago despite the market's recovery.
- • AI-related companies continue to lead the market. While enthusiasm cooled somewhat late in the quarter, many of the year's strongest performers remain tied to memory, semiconductors, and data-center infrastructure.
- • We believe that the American economy remains strong. Across the dozens of data points which we track in our proprietary database, the overwhelming majority continue to signal expansion.
- • We believe that we are still in the middle stage of a bull market.
- • Although GDP has been unusually volatile because of trade distortions and government spending fluctuations, it has remained positive. Meanwhile, Gross Output—a broader measure of economic activity—has continued to show remarkably steady growth.
- • Bank lending continues at a rate indicative of a healthy and growing economy.
- • After what was generally a slow erosion for most of 2025, unemployment figures have mostly strengthened in 2026.
- • Both the U.S. manufacturing and larger services sector report expansion in 2026. This is after manufacturing spent the two proceeding years in a contraction. We also see continued economic strength in macroeconomic data points such as Truck Tonnage Shipped.
- • The biggest issue in the economy remains persistent, sticky, and even accelerating inflation. We wrote at the end of last year about the market getting ahead of itself in projecting multiple rate cuts for 2026.
-
SECOND QUARTER PERFORMANCE
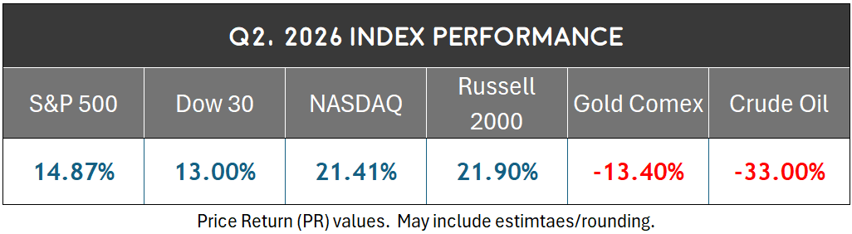
After a difficult first quarter, with nearly all indices down to start the year, the stock market staged a dramatic rebound in the second quarter of 2026. The rebound was strong enough to pull all key equity benchmarks into positive territory for the year; some now strongly positive.
Small company stocks thrived to start 2026, as they often do following rate cuts. The Russell 2000 gained roughly 22% in the first half of 2026—its strongest start since 1991. It outperformed the S&P 500 by more than 12 percentage points, its best first-half relative showing since 2001.
Commodities struggled during the quarter, with gold and crude oil both retreating sharply. Oil, after spiking in the first quarter following the beginning of the Iran conflict, fully retraced to approximate pre-war levels by the end of June.
A MID-CYCLE BULL MARKET
The economy remains in a period of economic expansion. A worthwhile question isn’t whether this is the case, but how far we are through an economic growth cycle. With many of the data points which we track indicating a positive environment, we have come to believe that we are in neither the early nor later stages of an expansionary cycle.
There is always some weakness in the data. Economic indicators are almost never all positive or all negative, and the larger the pool of data the more likely some divergence becomes. Economists and Investment Managers are primarily looking for degrees of concern; in what direction, and by how much, does the data lean?
Current economic characteristics which suggest a healthy, “mid-stage” bull market:
- • Continued economic expansion as measured by Gross Domestic Product (GDP) or Gross Output (GO) data.
- • Companies consistently overperforming profit expectations (analysts struggle to keep up with the growth).
- • Consistently low stock market volatility compared to either earlier in the “bull market” cycle or in the later stages of it (though this has been clouded by the Iran conflict).
- • Sufficient, and even expansionary bank lending (towards the extremes of economic cycles, banks tend to lend more cautiously).
- • Stable or expansionary employment conditions which can support consumer demand.
- • Stable household balance sheets combined with expansionary spending patterns.
-
Economists look closely for signs of an economic peak, which are largely the inverse of the prior bullet points. To name a few:
- • A sustained rise in unemployment.
- • Deterioration in bank lending / credit availability.
- • Widening credit spreads (the cost of financing starts climbing to finance less creditworthy debt).
- • Consumer stress building: climbing outstanding debt / rising delinquency rates
- • Corporate earnings revisions peak and end cycle of outperformance
- • Rising market volatility / market leadership narrows
-
IRAN CONFLICT: FUTURE EXPECTATIONS
As our last quarterly report was published, the conflict in Iran was still an active military engagement. This would only be true for a few more days as, on April 7th, a two-week ceasefire was agreed upon. The “two weeks” would be extended multiple times, through most of the quarter during negotiations.
The parties officially signed a Memorandum of Understanding on June 17th, though they seem (publicly, at least) to be far apart on several key issues. For economic purposes, the primarily difference is Iran’s belief that the settlement will allow them to charge “service fees” in the Strait of Hormuz while the U.S. firmly denies this.
Focusing purely on the political, it seems unlikely that the United States wishes to return to a status of active battle ahead of the midterm elections. This is not to say that the conflict won’t reignite. In fact, especially in the near term, it is a distinct possibility. Our base case remains that the current détente continues, though the risk of renewed confrontation cannot be dismissed with two sides who are supposedly at “agreement” yet publicly seem far apart.
Because of the short-term nature of the conflict—as it stands today—the long-term economic impact to the United States may ultimately prove minimal. We wrote last quarter:
“…the longer the conflict drags on, the bigger the impact on the economy becomes. Investment [markets] at this point revolve around the timeline.”
There were some temporary dislocations related to inflation, but the market has, otherwise, largely moved past trading on the conflict. Barring any major and unforeseen developments, this will continue to be the case as investors focus more on corporate earnings, inflation, and monetary policy. Oil has already returned to pre-conflict levels and stocks have climbed since the cessation of hostilities.
ARTIFICIAL INTELLIGENCE IN THE MARKET
Artificial intelligence remained the dominant investment theme during the first half of 2026. The narrative, however, shifted meaningfully between the first and second quarters.
In the first quarter of 2026, the market had moved into a cycle where artificial intelligence-related concerns were one of the leading market drivers. For most of January and February, seemingly any announcement from AI business Anthropic (among others) sent relevant market sectors into freefall.
The second quarter saw investors rotate back toward companies building the infrastructure needed to support AI. Memory manufacturers, semiconductor equipment suppliers, networking companies, data-center operators, and even industrial businesses connected to construction all significantly outperformed. Meanwhile, many software companies continued to lag as investors questioned how quickly AI investments would translate into profits (or act as competition).
At the same time, the market turned cold toward businesses who may be the ultimate beneficiaries of AI, but whose unprecedented capital expenditures created investor concern over near-term returns. Names like Microsoft, Alphabet, Amazon, and Meta all lagged the broader market rally.
One notable shift during the quarter was corporate capital allocation. Several of the largest technology companies chose to direct cash flow toward AI infrastructure rather than accelerating share repurchase programs. Management teams appear increasingly convinced that expanding AI capacity currently offers a better long-term return than buying back their own stock.
Businesses funding the AI infrastructure buildout will increasingly be expected to demonstrate corresponding revenue growth as those investments begin to mature. We believe we are moving into a phase where the market will be hunting for tangible beneficiaries of AI and, further, that some of those winners will actually start to become clear. By the end of 2026, companies that successfully translate AI investment into measurable revenue and earnings growth are likely to distinguish themselves from those still operating primarily on future expectations. The former will be granted a much larger leeway in terms of continued capital spending.
ECONOMIC FRAGILITY & MARKET MOMENTUM
VOLATILITY & STOCK MOMENTUM
The Lifetime Momentum & Volatility Index (LMVI) is a short-term investment and volatility framework which tracks four key market indicators across roughly a dozen screening formulas. Out of the four components in the index, two are market/momentum based while the other two relate more to credit and economic strength. Together, they help distinguish between ordinary market volatility and periods of elevated systemic risk. The model is intentionally designed to be slow-moving and should only issue a meaningful warning a handful of times during a typical year. It reports on a scale of -4 (risk-off) to +4 (risk-on).
After turning negative earlier in the year, leading up to the Iran conflict and AI-related investment declines, the indicator had climbed to neutral by April 3rd—right at the market bottom—and has returned a positive score since April 10th. The current score is +2.

ECONOMIC FRAGILITY
The Lifetime Early Warning System (LEWS) is intended to diagnose economic fragility.
Its eight components are forward-looking economic and market indicators. These include yield curve tests, jobless claims, bond spreads, defensive market rotations, and bank lending. Unlike our volatility index, LEWS is attuned to be highly sensitive and rise at the first sign of stress.
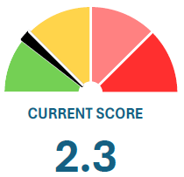
On a 0-10 scale, the indicator currently has a mild score of 2.3 (categorized as “Benign”).
The Early Warning System score ticked up slightly during the Iran conflict, briefly touching 2.8. However, it has scored in the “Benign” category for most of the year. The indication of low economic fragility helps to factor against taking a defensive posture with investments.
STRENGTH-OF-CONSUMER INDICATORS
Our study of consumer strength tracks nearly a dozen data points and splits cleanly into two sub-indices:
Labor Market Strength includes key indicators such as unemployment data, job openings, (voluntary) job quitting, payroll growth, and jobless claims.
Consumer Health reflects the balance-sheet strength of households. Factors include debt levels, delinquency trends, and the purchasing power of wages.
LABOR MARKET STRENGTH
Last quarter, we wrote about a “labor market [which] is defined by both low hiring and low job loss”. While that characterization still largely holds true, 2026 is also defined by an employment market which has improved over the last year after showing some weakness.
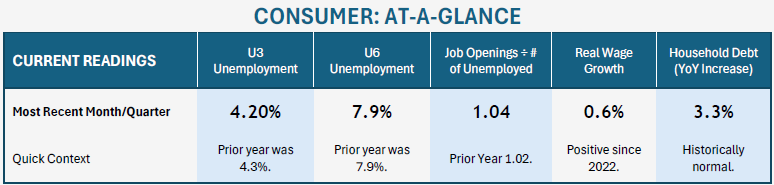
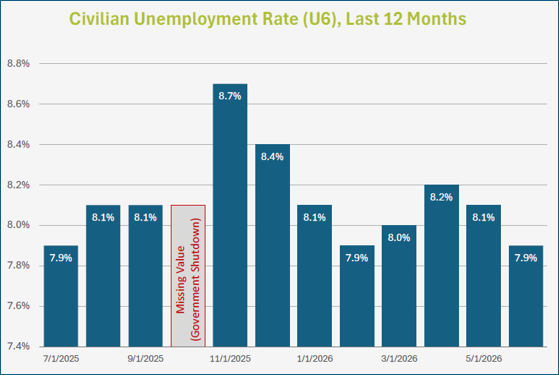
When tracking the labor market, our favorite indicator is the U6 Unemployment Rate which, after spiking last November to the highest level since 2021, has steadily improved over the last six months. The value is now unchanged from where it was one year ago: 7.9%. It is now between the averages for the last five years (7.5%) and ten years (8.5%).
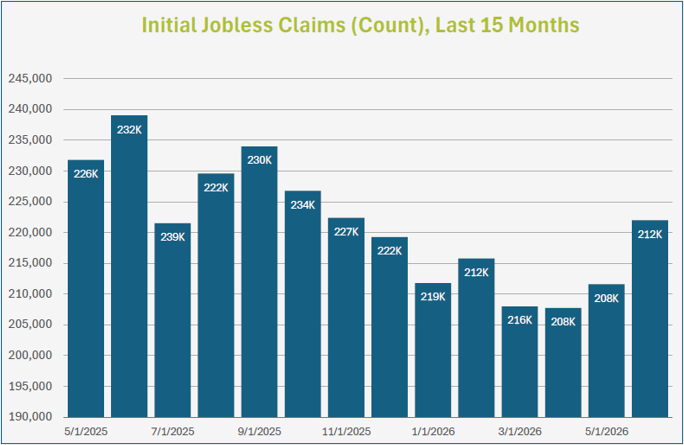
Another key labor indicator which economists track as forward-looking/predictive are Initial Jobless Claims. They measure the number of individuals filing for unemployment benefits for the first time, providing a timely indicator of labor market conditions. Despite expectations from some economists that claims would begin to rise, they have actually edged lower over the past year, with the latest reading at a still moderate 212,000.
CONSUMER HEALTH
We don't completely dismiss the popular narrative of a "K-shaped economy," where persistent inflation has disproportionately affected lower-income households. Even so, we believe the broader "stretched consumer" narrative has become somewhat overstated.
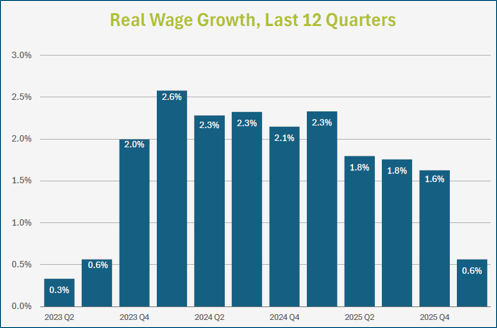
Real Wage Growth faltered during “peak inflation”, running negative for about two years. Since then, even with continued persistent inflation, wages have now outpaced inflation for twelve straight quarters.
Total Consumer Credit Outstanding, a measurement of all consumer indebtedness (including mortgages, credit cards, student loans, etc.), has climbed by 3.3% over the last year. This is slower than the five-year average of 4.81%. For context, it is normal for Consumer Credit to climb over time. It only becomes concerning when debt growth begins accelerating materially.
Credit Card Delinquency Rates are also fractionally lower than one year ago (2.92% vs. 3.06%).
Consumer spending remains the backbone of the U.S. economy. The data continues to show healthy spending activity, but importantly, that spending is not currently being financed by a rapid increase in household debt. Taken together, the broader picture remains one of a consumer that has proven considerably more resilient than many expected.
MACROECONOMIC INDICATORS
We track numerous macroeconomic indicators which can generally be broken down into two categories: Economic Growth and Inflation. The factors continue to depict an economy which is strong coupled with sticky inflation which began to reassert itself in late 2024.
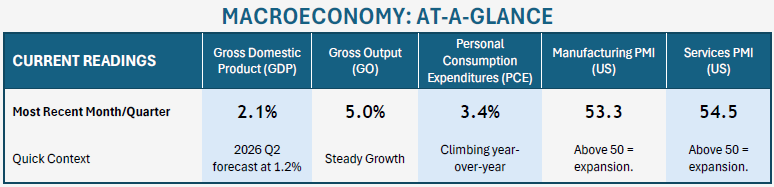
While inflation remains an issue for the American economy, almost all of the other macroeconomic indicators which we track indicate a stable trajectory of growth. This is true with broad economic estimates (GDP or Gross Output), sector estimates (manufacturing or services) and shipment data (such as Truck Tonnage Shipped or Industrial Production measurements). Most report strength.
ECONOMIC GROWTH
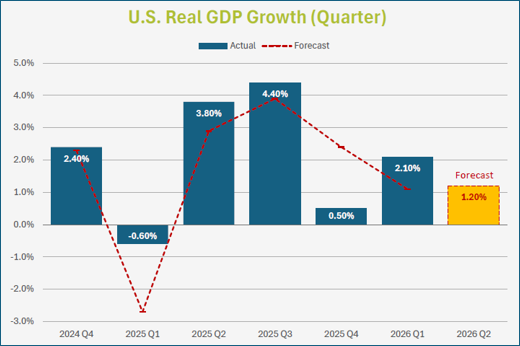
The Federal Reserve Bank of Atlanta publishes the GDPNow forecast which estimates Gross Domestic Product (GDP) growth in real time as each quarter progresses. Where they projected that the fourth quarter of 2025 was coming in at 1.10% annualized growth, the actual final result for the quarter was stronger GDP growth of 2.10%.
Recent GDP data has been unusually volatile, partly because of trade-related distortions and shifting government activity. Tariff-related front-running pulled imports forward, weighing on net exports, while changes in federal spending created additional noise. Together, these factors dragged on headline GDP and made the underlying trend harder to interpret.
Because of that volatility, we also emphasize Gross Output (GO) as a broader gauge of economic activity. Similar in concept to GDP, it captures total sales across all industries, including both final goods and services and intermediate inputs.
The most recent Gross Output data shows year-over-year growth of 5.0%; the strongest value since 2023. Gross Output has been between 4.2% and 5.0% for each of the last eight quarters, depicting stable economic growth not seen in GDP.
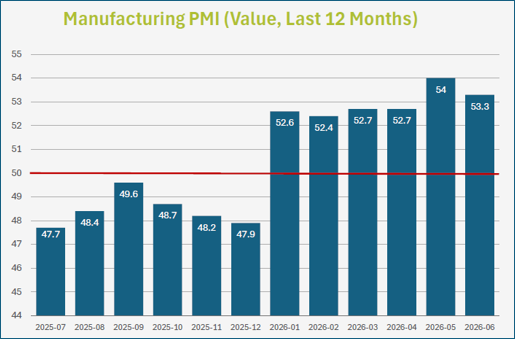
The Purchasing Managers’ Index (PMI), compiled by the Institute for Supply Management (ISM), conducts surveys with purchasing managers regarding orders, production, and employment. They are a leading indicator of economic health. We track both the Manufacturing and Service sectors. In this data, 50 is the watermark value. Under 50 indicates a contraction, while values over 50 indicate expansion.
The Services indicator includes categories such as Finance, Healthcare, and Retail, and makes up over 70% of the economy. Recent readings have been predominately positive (only one negative month in over two years) and the current level of 54.5 indicates strong continued expansion. ISM’s semiannual forecast projects continued expansion in 2026.
Manufacturing PMI figures, which spent most of 2024 and 2025 in a contraction, have shown a sudden rebound in 2026. While a return to expansion was expected at some point (ISM’s Fall 2025 Semiannual Forecast said manufacturing supply managers expect overall growth in 2026 and are “more excited about faster growth in the second half”) it was surprising to have the rebound suddenly upon us. Prior to the last six months, only two of the previous forty-eight months had been positive.
INFLATION
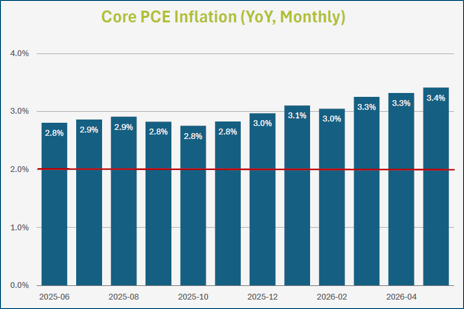
Core Personal Consumption Expenditures (PCE) inflation reported most recently in January at an annualized growth rate of 3.4%. In addition to remaining more than 50% higher than the Fed’s 2% target, it was the highest reading since late 2023. This reasserting inflation is perhaps the biggest current problem with the American economy (and the biggest part of why consumer sentiment remains deeply negative).
Unless the labor market softens, or unless PCE inflation numbers see material moderation in 2026, the Fed is unlikely to move into another round of interest rate cuts. In fact, our current expectation is for the Fed to neither hike nor cut in 2026.
MONETARY INDICATORS
To monitor the monetary condition of the United States economy—often analogized as the oil of an economic engine—we track roughly one dozen data points which can be broken into two broad categories: Federal Monetary Policy and Lending and Liquidity.
Federal Monetary Policy focuses primary on the movements of the Federal Reserve: both in its manipulation of the Federal Funds rate and the movements of the federal balance sheet. The Federal Reserve helps to set the table of economic conditions.
Bank Lending & Liquidity is one of the great early indicators of expansions and contractions. Almost every recession is presupposed by banks tightening their lending standards and volume. Banks go through cycles where they fear they are “missing out” by not lending more, eventually pivoting to times where they are restrictive and fear they won’t get their money back.
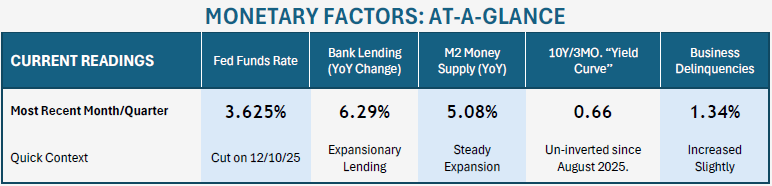
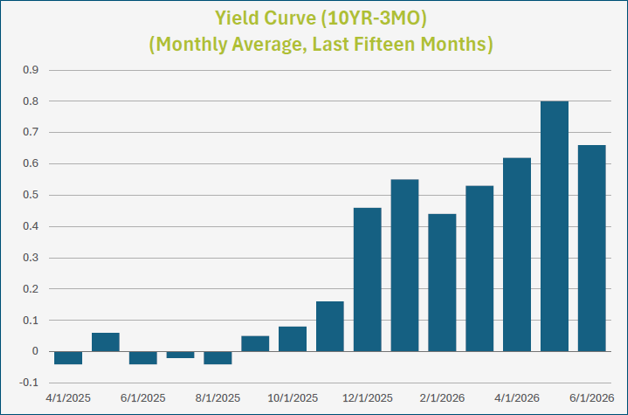
Progressing through 2026, monetary indicators point toward a stable-to-improving picture for the American economy. While still narrow, the yield curve is near its widest un-inversion in nearly three years. Bank lending remains unrestricted and money supply growth has normalized.
FEDERAL MONETARY POLICY
One of the primary drivers of stock valuations is the overall interest rate environment. Historically, one of the greatest catalysts for stock value increases is a reduction in the Effective Federal Funds Rate. The logic is straightforward: as rates drop on instruments like CDs, there is less competition for stocks. Also, lower rates directly impact the bottom line of stocks: the lower the cost of debt servicing, the greater the profit. Conversely, higher interest rates increase the attractiveness of cash and fixed-income investments while raising borrowing costs for businesses.
By the end of 2025, the Federal Reserve had lowered its target rate by three-quarters of a percentage point to 3.625%. Although still historically restrictive, policy rates have declined roughly 25% from their peak.
At the beginning of 2026, the CME Group FedWatch predictor tool, was expecting multiple rate cuts, and we wrote at the onset of the year that “projections for multiple rate cuts [for 2026] are premature”. Largely due to reasserting inflation, the market is now pricing in a base case of one rate hike during the year.
We believe that any adjustments to the Fed Funds rate are unlikely until the Fed sees more material changes in the data, either toward softening employment or softening inflation. Neither hikes nor cuts seem likely at the moment.
The M2 Money Supply has grown at a stable, normal rate of 5.08% over the last year. This represents a moderate acceleration from a year ago (3.77%). The rising rate of money supply may have some connection to rebounding inflation.
Another underappreciated development occurred in December 2025, when the Federal Reserve formally concluded its multi-year program of quantitative tightening. We view that as another incremental positive for financial conditions and equity markets.
BANK LENDING & LIQUIDITY
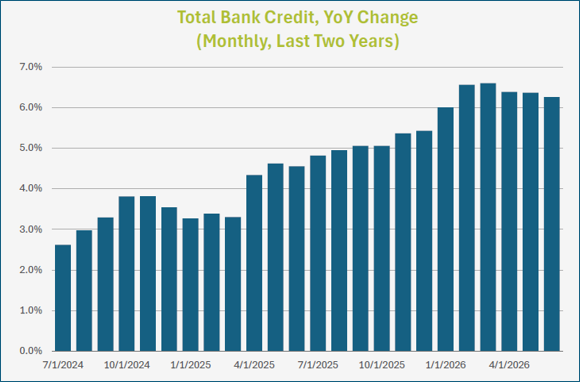
The Federal Reserve database measures Total Bank Credit (All Commercial Banks) as a dollar value of all loans and securities held by U.S. commercial banks. While bank lending can expand during a recession, it tends to do so at a much slower rate when banks are worried about getting a return on their investment. Tightening credit is one of the major hallmarks of an economic slowdown. Fortunately, we don’t see any weakness here. During the past twelve months, commercial bank credit has increased from $18.49 trillion to $19.65 trillion, a healthy 6.3% gain consistent with an expanding economy. For reference, Total Bank Credit contracted during the Great Recession, surged as high as 12% during the early 2,000’s boom-and-bust cycle, and tends to pace around 3-6% during periods of economic expansion.
One of the most effective predictors of recessions (or, at least, of investor fear) is the inversion of short-term and long-term bond yields. While analysts use different ranges, we focus on the traditional yield-curve between three-month and ten-year treasuries.
The 2022–2024 cycle represents one of the rare instances in which the yield curve inverted without an immediate recession following. During 2025, the curve fluctuated between inverted and not dozens of times before finally trending toward normalcy in the second half of 2025. Presently, at the end of the second quarter of 2026, the yield curve is near the steepest un-inversion since 2022. While still flatter than during a typical expansion, it has remained positively sloped for nearly a full year and continues to normalize.
MARKET FUNDAMENTAL INDICATORS
Our analysis of stock market fundamentals includes a framework for both long-term and short-term investment decision making.
Along with many other data points, to maintain a wide, macro concept of the investment market we monitor market-wide earnings ratios (focusing on the S&P 500 but studying many indices). We also monitor and search for trends in corporate stock performance as announced during quarterly earnings announcements.
We additionally maintain a proprietary short-term market momentum/volatility framework to establish pockets of immediate caution or optimism.
PRICE-TO-EARNINGS RATIOS
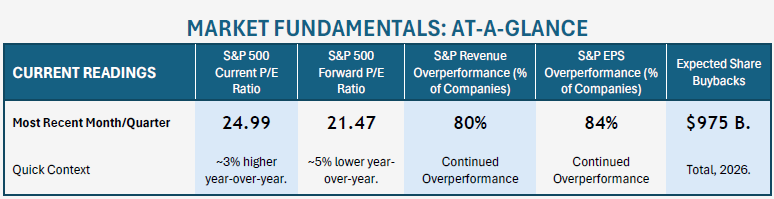
We noted in our first quarter analysis that, “stocks are currently among the cheapest levels of the last three years”. Stock valuations have rallied since then, pulling themselves back to recent historical norms.
Compared to values one year ago, current price-to-earnings ratios show stocks to be slightly more expensive by about 3%. The current value of 24.99 compares to the year-ago level of 24.09.
While the “current” ratio is the one that gets the most publicity, stocks tend to be valued based on expectations of future earnings. Investors buy stocks based on what they expect companies will earn in the future, not what they earned in the past. At 21.47, the current Forward P/E Ratio of the S&P 500 is still among the cheapest levels of the last several years. While stocks have rallied recently, they have done so in correlation with rising business earnings (and sentiment).
EARNINGS SEASON
A hallmark of a bull market is corporate profits which are climbing faster than analyst estimates. Similarly, a hallmark of a market peak is when companies begin to fail to outperform expectations (as projections of growth become ever loftier). This is why investors look so closely at quarterly stock announcements.
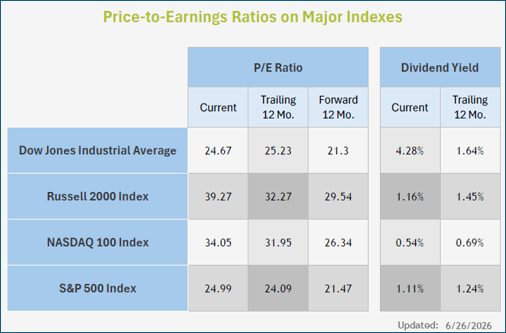
The recent Earnings Season, announcing company revenue and earnings per share for the first quarter of 2026, has seen historically massive overperformance—especially on the earnings side.
80% of companies overperformed revenue expectations and 84% beat net earnings expectations. The margin of overperformance was dramatic: revenue overperformance of 1.8% (historically typical) but earnings (essentially, net profit) overperformance of 18.2%.
Analysts remain optimistic about corporate profits for the remainder of 2026. Current consensus forecasts call for another year of robust earnings growth, supported by continued revenue expansion, healthy profit margins, and broad participation across nearly every sector. Over the long run, sustained earnings growth remains one of the strongest drivers of stock prices.
OTHER VALUATION NOTES
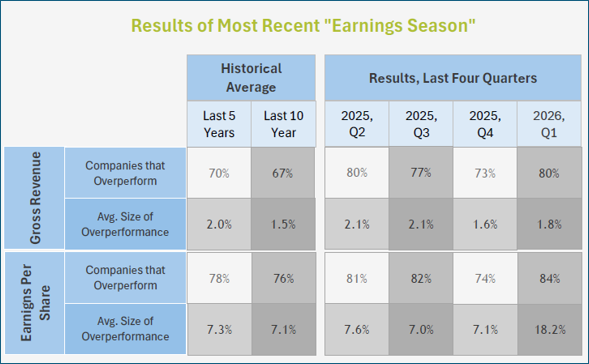
- • Share repurchases remain elevated, with S&P 500 companies on pace for $975 billion in buybacks in 2026. Activity appears somewhat constrained by high AI-related capital expenditures, though buybacks remain near historically strong levels.
- • Dividends continue to grow at a steady pace, rising approximately 5–7% year-over-year, with strength led by financials and large-cap industrial companies.
- • Analysts have continued raising—not lowering—2026 earnings expectations, a relatively uncommon development this late in an economic expansion and one that reflects continued confidence in corporate profitability
- • AI-related commentary remains a dominant theme in earnings calls, with companies increasingly focused on monetization, cost efficiency, and capital expenditures tied to artificial intelligence.
CONCLUSIONARY FORECAST
The second quarter largely unfolded as we expected. Concerns surrounding geopolitical conflict gradually subsided, corporate earnings substantially exceeded expectations, and the broader economy continued to demonstrate resilience. While inflation remains more persistent than we would prefer—and valuations have become somewhat less attractive following the market's rebound—the overwhelming majority of our economic and market indicators continue to support an expansionary outlook.
Looking ahead, we believe the market is entering a new phase. Rather than debating whether artificial intelligence will reshape the economy, investors are increasingly asking which companies will successfully monetize that investment. Likewise, attention has shifted away from geopolitical headlines and back toward the traditional drivers of long-term returns: earnings growth, productivity, and monetary policy.
As we wrote on June 1st for our blog, over the next few weeks the rally might be difficult to sustain until we move into the next earnings season:
While the recent stock rally is technically justified, it will be difficult for stocks to maintain their recent [momentum] until the next earnings season begins in July. Until then, we are likely in a window of increased volatility and markets which will be more sensitive to price pressures (oil, inflation) and headline news… than they were in May.
Although the risks facing the market have changed over the past several quarters, our overall conclusion has not: the evidence continues to favor economic expansion over recession.
No forecast is certain, and periods of volatility should always be expected. Even so, our models continue to depict an economy with healthy underlying fundamentals and a market that remains supported by corporate profitability. While we expect the path forward to remain uneven, we continue to believe the primary trend for both the economy and equities remains positive.
Reach out with questions or comments! tony@lifetimeretirementpartners.com